Shedding “light” on a Picasso!
Overview
Overview
Keywords: multi-spectral imaging, light, electromagnetic spectrum
Subjects: physics, ICT, art
Age group: 12-15 years (extension activities for ages 16-18)
Time frame: 45 - 90 minutes per activity

This project by Kalliopi Giannakoudaki and Georgios Chatzisavvas was presented at the European Science on Stage festival 2024 in Turku, Finland. The project introduces students to multispectral imaging.
Conceptual Introduction
In 2014, scientists and art conservators from the Phillips Collection, the National Gallery of Art, Cornell University and the Winterthur Museum discovered the form of a man under the main painting of a Picasso, using infrared technology! More specifically, a bearded man wearing a bow tie and supporting his head with his hand appears beneath the famous Picasso’s painting “The blue room”.[1] However, this is not the first time that a hidden image has been revealed beneath a painter's artwork.[2]
Technology and modern imaging techniques are constantly revealing new elements and hidden details of artworks, and thus constantly changing the way we perceive art. The main idea behind the use of MSI in artworks is the following: the degree of penetrating radiation into the artwork depends on the wavelength of the radiation. So, you can study different layers of an artwork by simply using different wavelengths of light.
Below (see figure) the different degrees of penetration of radiation into the work of art depending on the wavelength are illustrated. The top layer (light blue colour) corresponds to the varnish, the next layer (green colour) corresponds to the colours of the artwork, the next layer (grey colour) corresponds to the draft, followed by the canvas (white colour) and the support wood (brown colour).
As you can see, varnishes used on the surface of artworks have the property to fluoresce after excitation with UV radiation with a wavelength between 300nm-400nm. On the other hand, visible radiation penetrates the varnish and reaches a level below it. Finally, infrared radiation penetrates the varnish and the entire colour layer and reaches the artist’s draft.
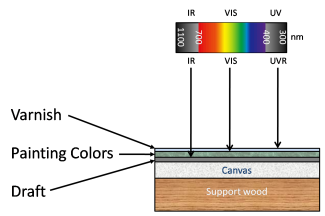
Penetration depth of different kinds of radiation
Activity 1: MSI using Ultraviolet Radiation
→ age groups 12-15, 16-18
This activity is related to Ultraviolet (UV) fluorescence imaging. UV fluorescence is based on the property of certain pigments to fluoresce in the visible region of the spectrum after excitation with ultraviolet radiation with a wavelength between 300nm-400nm. Varnishes used on the surface of artworks, whether older or more modern, have the property to fluoresce in contrast to any later interventions or surface damage, which appear as dark spots without any fluorescent property. Therefore, with this particular technique it is possible to examine and diagnose the state of conservation of the painted surface of an artwork.[5]
Materials
- UV lamp/torch
- a drawing
- varnish
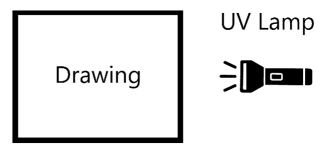
Diagram of the experimental setup (Activity 1)

An example of a UV lamp (a) with its electromagnetic spectrum (b).
- Ask your students to draw a picture.
- Cover a part of the picture with opaque varnish.
- Lighten the drawing with the UV lamp/torch and observe the fluorescence.
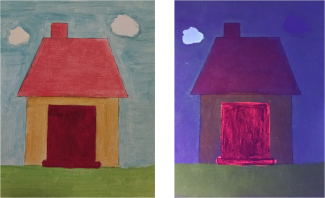
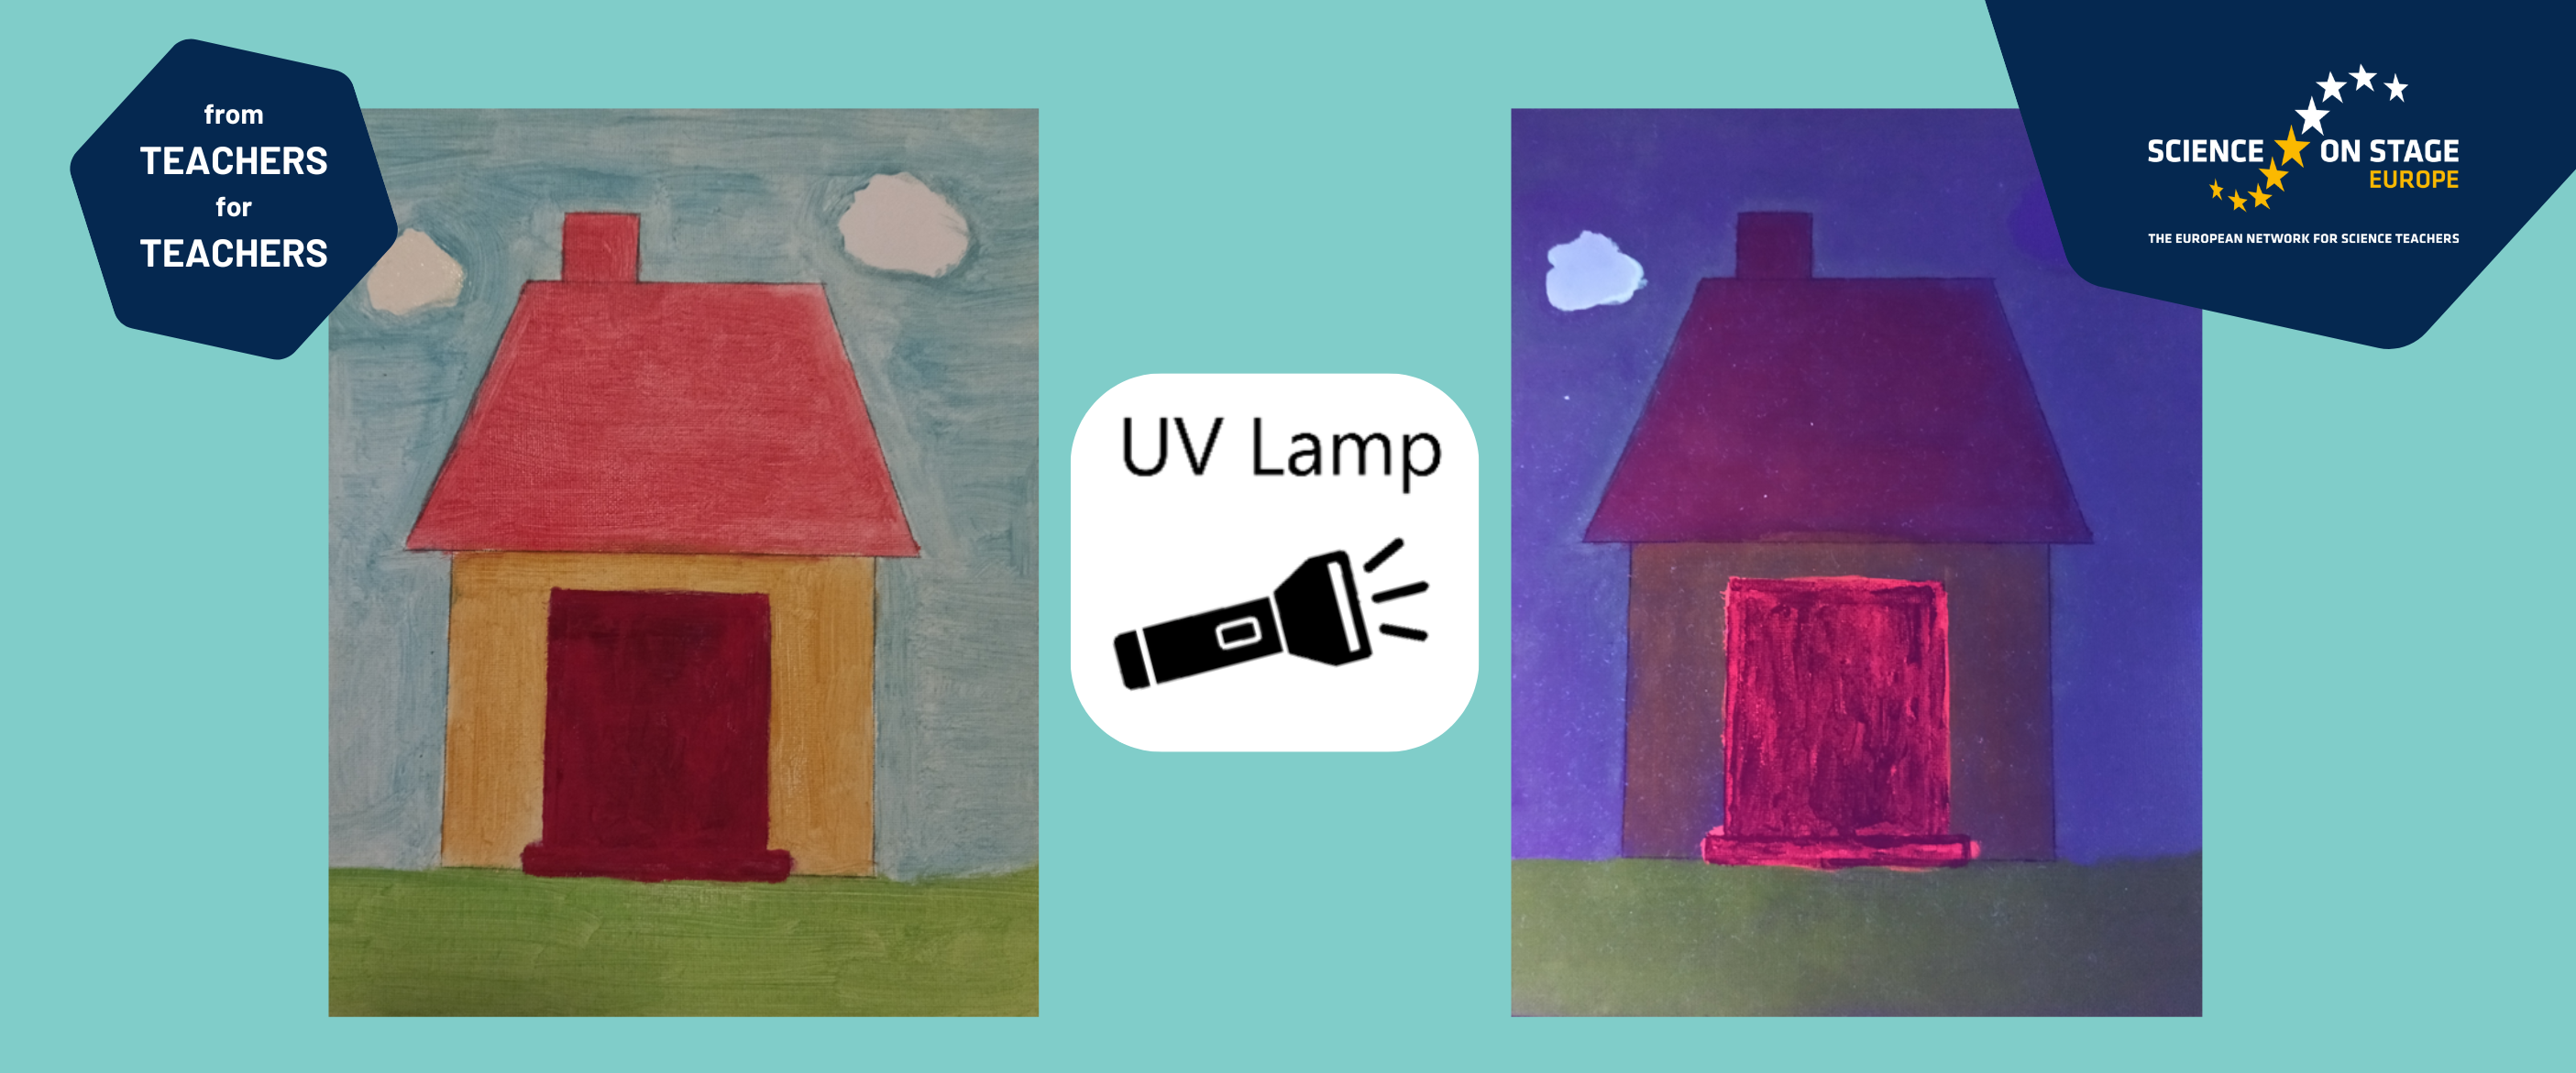
One cloud is covered with varnish while the other is not. Left: the painting is illuminated with normal lighting. Right: the painting is illuminated with a UV lamp.
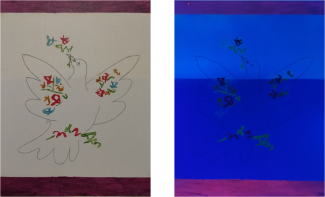
The upper half of the painting is covered with varnish, while the rest is not. Left: the painting is illuminated with normal lighting. Right: the painting is illuminated with a UV lamp.
Safety note
Please be careful when using UV light. Ensure that students do not look directly into the light source, and check for guidelines in your country.
Activity 2: MSI using Visible Radiation
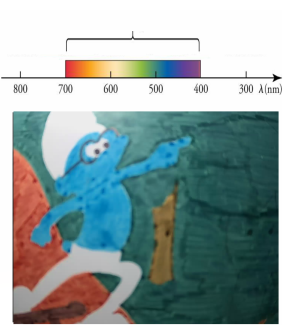
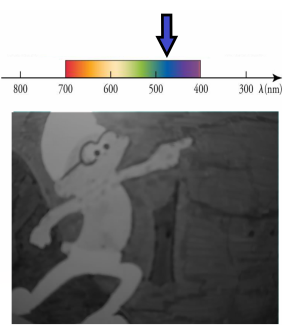
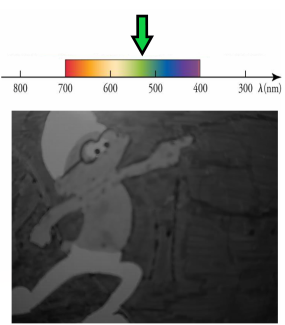
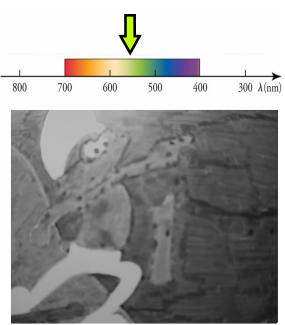
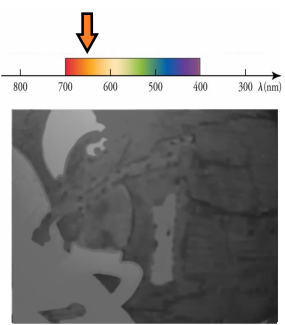
Imaging using radiation in the visible region of the spectrum gives us information about the artist's work itself, since visible radiation penetrates the varnish and reaches a level below it. The use of different filters can allow the selective passage of light. The images of the painting are captured by a typical IP camera and can be converted to black and white (grayscale) for easy identification of areas that absorb radiation (black areas) and areas that reflect radiation (white areas), as shown in the figure below.
This activity can be implemented in two alternative ways depending on the age level of the students. In the first case, the filters are placed in front of the camera by hand. In the second case, a rotating platform is constructed and controlled by an Arduino microcontroller.
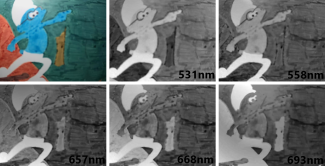
Different representations of the same painting according to the wavelength.
Activity 2 – low difficulty
→ age group 12-15
Materials
- a drawing
- visible bandpass filters (i.e. filters from school lab used for studying the photoelectric effect)
- IP camera
- smartphone (or router and laptop/PC)
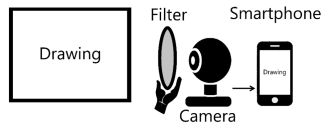
Diagram of experimental setup (Activity 2 - low difficulty)
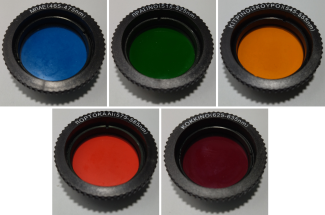
Visible bandpass filters
You will need a typical IP camera. Connect the camera with the smartphone following the directions of the manufacturer of the camera, in order to be able to see what the camera captures. Alternatively, the camera can be connected with a laptop/PC through a router. The drawing is placed in front of the camera, while various visible bandpass filters are inserted between the camera and the painting, which allow the selective passage of light through the camera lens.
Activate grayscale on the smartphone by selecting the appropriate option on main menu [6]. This option enables you to easily identify the areas that absorb radiation (black areas) and the areas that reflect radiation (white areas).
- Ask your students to draw a picture with various colours.
- Place the picture in front of the camera.
- Place one filter, with your hand, in front of the camera and ask your students why some areas of the painting are black and others are white.
- Place all the filters one by one and observe how the brightness of a certain area (e.g. the blue colour of the smurf) changes.
- Encourage your students to replicate the images!
Activity 2 – moderate difficulty
→ age group 16-18
Materials
- a drawing
- filters
- IP camera
- PC/laptop
- router
- software [sources: 2]
- a rotating platform
- Arduino board
- 5V power supply (or Dc Power Jack Cable Female Connector)
- a servo motor (we used MG996R Servo)
- hook-up wires
- breadboard
- paper boxes
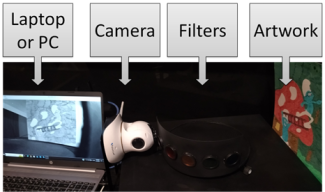
Photograph of the experimental setup (Activity 2 - moderate difficulty)
- Construct the rotating platform following the instructions on the authors' page (or download the instructions as pdf) and upload the sketch to the Arduino. [sources: 1]
- Connect the laptop/PC with the camera and with the Arduino.
In order to reproduce what the camera records on the computer screen in a continuous video stream, we have created a program using a free software b4j, while the camera is connected via a router with the computer. With this program we can control the various functions of the camera, e.g. day-night mode, black and white display, etc. Finally, with this program we can send commands to the Arduino to rotate the platform.
- Download the Picasso_b4j_Executable.zip file. [sources: 2]
Unzip this file and execute the Picasso.exe file. [sources: 2]
Note: Each camera uses its own communication protocol. You might have to modify the source code in order to connect the program with the camera.
- Ask your students to draw a picture with various colours.
- Place the picture in front of the camera.
- Rotate the platform, using the software, in order to place one filter in front of the camera.
Examine which areas of the painting are darker than the others and try to figure out why this is happening.
Optional:
- Follow the step-by-step guide in order to get the intensity normalization. [sources: 3]
- Follow the step-by-step guide in order to get the graph of intensity. [sources: 4]
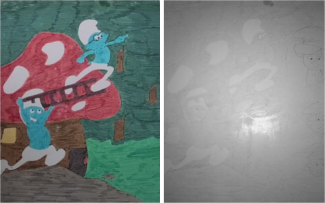
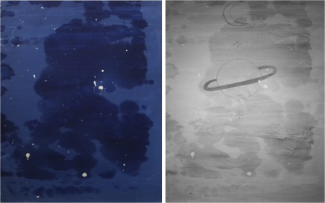
Activity 3: MSI using Infrared Radiation
→ age groups 12-15, 16-18
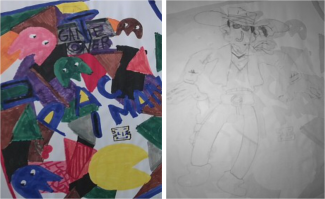
Imaging using infrared radiation uses the near infrared region (750nm to 2500nm). The radiation penetrates the first layer, which is usually the varnish or even the entire colour layer and thus reaches the artist's draft.[7] Graphite, mainly used in an artist's draft, strongly absorbs infrared radiation.

Artwork in the visible spectrum (left) and the same painting illuminated with infrared radiation (right)
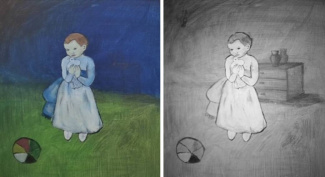
Artwork in the visible spectrum (left) and the same painting illuminated with infrared radiation (right)
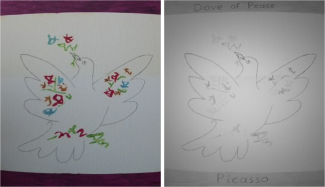
Artwork in the visible spectrum (left) and the same painting illuminated with infrared radiation (right)
Artwork in the visible spectrum (left) and the same painting illuminated with infrared radiation (right)
Artwork in the visible spectrum (left) and the same painting illuminated with infrared radiation (right)

Artwork in the visible spectrum (left) and the same painting illuminated with infrared radiation (right)
Artwork in the visible spectrum (left) and the same painting illuminated with infrared radiation (right)
Materials
- a drawing
- IP camera
- smartphone (or router and laptop/PC)

Diagram of experimental setup (Activity 3)
- Ask your students to draw a sketch with a pencil.
- Ask your students to cover the sketch with markers or other paint (watercolours, oil paint, etc.).
- Place the painting in front of the camera and set the camera into night mode (either by closing the lights or by covering the light sensor of the camera).
- Ask your students to search in the web for other paintings that have been analysed using MSI.
Conclusion
The specific experimental process is an opportunity for secondary school students to connect theoretical concepts found in school textbooks, such as the E/M spectrum, photons, wavelength, reflection, etc., with the observation of suitable optical phenomena, which often exceed the limits of our own senses. Research at an international level shows that the phenomena related to light and its properties are very difficult for students of all age levels, [8, 9, 10] which is also confirmed by our own daily experience in the classroom.
The aim of this project is on one hand to help students to face their personal preconceptions about light and its properties and to remove any misconceptions. On the other hand, it is an alternative teaching proposal for the teachers themselves. Materials found in school laboratories and free software are used in the experiment, and the cost of additional components is low.
Finally, the project cultivates the students' STEM skills, as the students are confronted with various challenges at a mathematical, technological and engineering level during the implementation and execution of the experiment. At the same time, however, this specific project also encompasses the students' love for the arts and the creation of their own "works of art", as an interdisciplinary approach was followed to achieve the final goal.
Project page
You find further information about the project alongside photos, instructions and ideas on the project page that the authors created!
Sources
- Rotationg platform:
Arduino sketch (sketch_Picasso.ino) → see below
Step by step instructions to build the rotating platform: Rotating Platform.pdf - Software for Laptop/PC:
Source code: Picasso_b4j_SourceCode.zip (link to the authors' drive)
Executable: Picasso_b4j_Executable.zip (link to the authors' drive) - Step by step procedure for intensity normalization: Intensity Normalization.pdf
- Step by step procedure in order to get the graph of intensity: Graph of Intensity.pdf
- Video of the project: https://www.youtube.com/watch?v=YIVfMgE_P68
Picasso's The Blue Room hides a secret painting, The Guardian 2014.
Subbarao, M. (1988). Parallel depth recovery by changing camera parameters. In 2nd International Conference on Computer Vision, pp. 149-155.
Barbara Krasnoff, How to turn your phone screen to grayscale, The Verge 2023.
(subscription needed)Knight, R., D. (2004). Five Easy Lessons: Strategies for Successful Physics Teaching. Addison-Wesley, San Francisco, CA.
Fetherstonhaugh T, & Treagust D., F. (1992). Students’ understanding of light and its properties: teaching to engender conceptual change. Science Education, 76, 653-672.
Karrqvist, C., & Andersson, B. (1983). How Swedish pupils, age 12–15, understand light and its properties. In H. Helm & J. D. Novak (Eds.), Proceedings of the International Seminar: Misconceptions in Science and Mathematics, pp. 380–392, Ithaca, NY: Cornell University.
About the authors
Kelly Giannakoudaki is a Secondary Education teacher in Model General Lyceum of Heraklion, Greece. She has many years of experience in teaching Physics mainly to students aged 12-18. She holds a PhD in Science Education and a master’s degree in microelectronics and optoelectronics. Her research interests mainly concern the teaching in out-of-school learning contexts and how these contexts could be beneficial for students when combined with formal education.
Photo: private

Georgios Chatzisavvas is a Secondary school science teacher at the 5th General Lyceum of Heraklion, Greece. He is passionate about making physics engaging and meaningful by combining theoretical concepts with hands-on applications. His main interest lies in integrating physics with robotics, helping students explore how scientific principles come to life through technology and real-world problem solving.
Photo: private
Share this page