CO2MUCH - Greenhouse Effect and Temperature

Overview
Overview
Keywords: Greenhouse effect, climate change, temperature, carbon dioxide, ice core, paleoclimatology, Vostok curves
Disciplines: Physics, chemistry, science, coding
Age level of the students: 13-15
Time frame: 4-5 lessons
![]()

Carbon dioxide and temperature in the air - the greenhouse effect
The students conduct an experiment to demonstrate the role of carbon dioxide in increasing air temperature in a simplified model of the greenhouse effect.
They program a microcontroller to take temperature and carbon dioxide measurements in a control container and a container containing excess carbon dioxide. The two containers are illuminated by a lamp representing the sun.
Goal
Students will prove that temperature increases with CO2 concentration.
Questions before starting
- Explain the greenhouse effect.
- Give examples of greenhouse gases.
Question to investigate or challenge
- Is there a relationship between carbon dioxide and temperature?
- Challenge students to design an experiment that proves their hypothesis.
Hypothesis
Students will write their hypothesis, which in most cases will be that as the carbon dioxide concentration increases, the temperature increases as well.
- 2 glass jars
- Plastic film
- 2 rubber bands
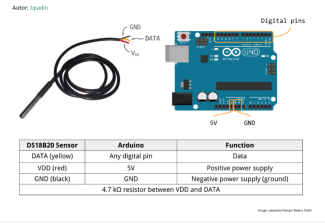
- CO2 Arduino sensor (ccs 811)
- 2 DS18B20 temperature sensors
- Breadboard
- 4.7 kΩ resistor for each temperature sensor
- Arduino UNO
- Electrical leads
- 100 mL of water
- One tablespoon of fruit salts (to produce CO2)
- Lamp emanating heat to emulate the sun
- Arduino LCD optional to show the data (serial monitor can also show the data)
Procedure
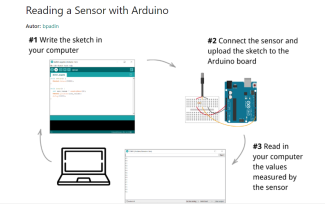
- Write the program on your computer to collect the data from the sensors.
- Add at least 100 mL of water to both jars.
- Put one temperature sensor inside each jar.
- Measure the initial temperature and CO2 concentration in each jar before the chemical reaction takes place and before turning on the lamp.
- Add the CO2 sensor in one of the jars (please notice that you can also use one CCS811sensor in each jar). That is the jar in which the production of carbon dioxide will take place.
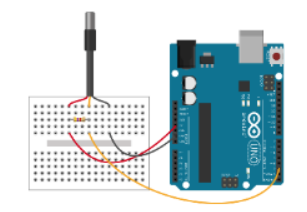
- Connect the Arduino UNO to the sensors (see images).
- Cover the jar which has only the temperature sensor inside with the film and fasten it with the rubber band. Students will gather temperature data from this jar without producing any CO2 inside it, so the CO2 concentration remains constant.
- In the other jar, place the CO2 as well as the other temperature sensor and cover with the film and the rubber band.
- Place the lamp close to the jars, making sure that the distances between the lamp and the jars are the same. The lamp will emulate the sun.
- While running the Arduino code, very quickly add a tablespoon of fruit salt to produce carbon dioxide inside the jar that has the CO2 and the temperature sensor and close the jar using the plastic film and the rubber band around it as fast as possible.
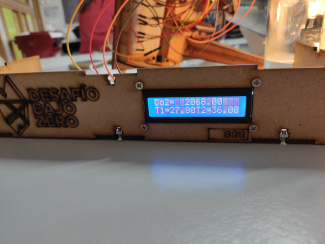
- Turn the lamp on and record data for several minutes observing the temperatures in both jars until a maximum temperature is reached.

Code example
Data
Students will collect and analyse data from the sensors they have programmed.
Example of data collection (time difference between initial and final measurement is 10 minutes)
|
|
Initial CO2 [ppm] |
Final CO2 [ppm] |
Intitial T [°C] |
Final T [°C] |
|
Jar 1 (without CO2 reaction) |
409 |
409 |
20 |
27.9 |
|
Jar 2 (with CO2 reaction) |
409 |
2068 |
21 |
37 |
The data shows that temperature increases much more in the jar where carbon dioxide is produced, even if that reaction is endothermic.
Final questions
- Relate the greenhouse effect to global warming and climate change.
- How can combustion reactions be related to the greenhouse effect?
- What steps can be taken to reduce the amount of carbon dioxide expelled to the atmosphere?
- What can you do about it?
- What can be done at your school?
Students explore documents through an H5P activity. They learn how scientists study past climates. They analyse the Vostok curves and make the link between temperature increase and carbon dioxide concentration. They compare the impact of human activities to other phenomena.
Conclusion
The students are able to confirm that carbon dioxide is responsible for the increase of temperature in the air and that it is the main cause of global warming.
Authors of CO2MUCH - Think Global, Act Local: Elena Poncela Blanco (ES), Philippe Mancini (FR)
Links to forward to your students
Share this page