Smart Cities - Air Quality

Overview
Overview
Keywords: smart cities, data acquisition, sustainable development, air quality index, sensors
Disciplines: mathematics, physics, environmental science, general science, informatics, technology, biology
Age level of the students: 11-18
Time frame: The project has two parts that can be completed independently or together. The theoretical part takes around 4 hours, and the practical part, as extracurricular activity, with 2 h/week around one school year
Partners: Nearby schools, research laboratories, local community
![]()
![]()

Good air quality is a prerequisite for a healthy life, but the air in our cities is increasingly polluted. Students will discover which are important parameters used to establish the air quality index. Then they can build a real analyser using sensors and different open-source electronics platforms to measure the chosen air parameters and to transfer the data in real-time. From data analysis, students can conclude about the air quality in their own city and can alert the the public, community and administration, so that appropriate measures can be taken.
The SDG 11 (Sustainable Cities and Communities) stipulates to make cities inclusive, safe, resilient and sustainable, but in 2016 air pollution caused 4.2 million premature deaths. Some gas pollutants make a big contribution to climate change (SDG 13 - Climate Action). These are motives enough to understand the importance of studying air quality [1] [2].
Defining air pollution
But what does fresh air mean? It is air with few aerosols (particulate matter and with low concentrations of toxic gases.
The teacher can explain the fundamental notions for air pollution. The students are divided into groups and each group will study one of the next topics:
- aerosols - the principal particulate matter: PM1, PM2.5 and PM10, their sources and effects
- toxic gases: ozone (O3), nitrogen dioxide (NO2), sulphur dioxide (SO2), their sources and effects
- the sources of carbon dioxide (CO2) and its contribution to the climate change
- how to calculate the air quality index [3]
Each group will make a presentation or a poster, turning the students into teachers for their colleagues and allowing them to learn by teaching.
The students can study the principles of physics that underlie the operation of sensors for air pollutants. For example, they learn about how the non-dispersive infrared (NDIR) carbon dioxide sensor [4] works or how the light scattering principle is implemented in a dust sensor [5].
Students may be challenged to discuss well known cases of pollution in modern history like the London pollution in 1952 [6], the increase of PM10 in Athens because of wildfires in August 2021 [7] or the presence of ozone in some Italian cities in June 2021 [8].
Analysing air quality - hands-on activity
The project goals for this part are to design and to build the electronic equipment, to register the air parameters in real-time and then to analyse them.
The first step is to decide what air parameters you want to measure.
The air quality index considered by the European Environment Agency is based on measurements of up to five key pollutants. The index corresponds to the poorest level for any of the five pollutants according to the following table [9]:
| Pollutant | Index level (based on pollutant concentrations in µg/m3) |
|||||
| Good | Fair | Moderate | Poor | Very poor | Extremely poor | |
| Particles less than 2.5 µm (PM2.5) | 0-10 | 10-20 | 20-25 | 25-50 | 50-75 | 75-800 |
| Particles less than 10 µm (PM10) | 0-20 | 20-40 | 40-50 | 50-100 | 100-150 | 150-1200 |
| Nitrogen dioxide (NO2) | 0-40 | 40-90 | 90-120 | 120-230 | 230-340 | 340-1000 |
| Ozone (O3) | 0-50 | 50-100 | 100-130 | 130-240 | 240-380 | 380-800 |
| Sulphur dioxide (SO2) | 0-100 | 100-200 | 200-350 | 350-500 | 500-750 | 750-1250 |
The European Union has developed an extensive body of legislation that establishes standards for a number of pollutants present in the air. These standards are summarised in the table below. These apply over differing periods of time because the observed health impacts associated with the various pollutants occur over different exposure times [10].
|
Pollutant |
Concentration |
Averaging period |
|---|---|---|
|
Fine particles (PM2.5) |
25 µg/m3 |
1 year |
|
Sulphur dioxide (SO2) |
350 µg/m3 |
1 hour |
|
125 µg/m3 |
24 hours |
|
|
Nitrogen dioxide (NO2) |
200 µg/m3 |
1 hour |
|
40 µg/m3 |
1 year |
|
|
PM10 |
50 µg/m3 |
24 hours |
|
40 µg/m3 |
1 year |
|
|
Lead (Pb) |
0.5 µg/m3 |
1 year |
|
Carbon monoxide (CO) |
10 mg/m3 |
max. 8 h/day |
|
Benzene |
5 µg/m3 |
1 year |
|
Ozone |
120 µg/m3 |
max. 8 h/day |
Devices made by students
CaeliBox 1 and CaeliBox 2 are hand-held mobile devices (560 g and 460 g respectively). While you walk in the streets of your town, you can register different air parameters which are saved on a server and you can observe all parameters in real-time on a website using a laptop or mobile phone.
CaeliBox 1
This device has sensors for particulate matter (2 types), sound level, TVOC and CO2. Because the air pollutants are influenced by the meteorological conditions, the device is equipped with temperature, humidity and barometric pressure sensors.
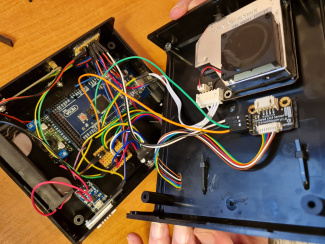
Caelibox 1
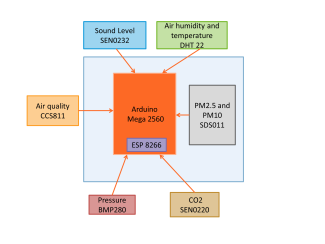
Caelibox 1 block diagram
The device is based on an ATmega2560 microcontroller board, ARDUINO MEGA 2560. A Wireless NodeMCU based ESP8266 WIFI module have been attached for sending the data to the server, using a PHP script, through an HTTP POST.
The power supply is made with two rechargeable 3.7V LiPo batteries, a step-up converter (3.3 V to 5V) to supply the Arduino, and a step-down converter to charge the battery.
We used components that are cheap, easy to connect with the Arduino board, with a low energy consumption (the device being autonomous), powered at low voltage and that provide the desired parameters:
- air temperature and humidity module DHT22, SEN0137;
- air pressure, BMP280, I2C barometer sensor, SEN 0226;
- air quality (CO2 + TVOC) sensor CCS 811, SEN0318;
- analogue sound level meter SEN0232;
CaeliBox 2
We wanted to improve the measurement performance and that is how the second analyser came about. It was clear that we wanted to send data in real-time to a server and also to plot the data for every parameter in real time like at the first device.
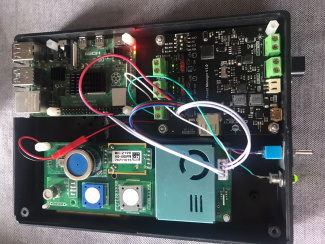
Caelibox 2
This time we measured more parameters in the air, using a multiple-in-one air quality module type ZPHS01B (as you see in Photo 2) and a Raspberry Pi 4B+ module: particulate matter with the size 0.3 - 10 μm (PM1.0, PM2.5, PM10), air temperature (-10 °C - 50 °C), air humidity (0 - 80 %RH), carbon dioxide (0 - 5000 ppm), carbon monoxide (0 - 500 ppm), ozone (0 - 10 ppm), nitrogen dioxide (0 - 10 ppm), formaldehyde (0 - 6.25 mg/m3) and TVOC (0 - 3 grades).
Advice
At the beginning it’s good to set one sensor at a time and check its correct operation and only after that to gather all sensors in a box.
In our experience, MQ series gas sensors were not ideal because they consumed a lot of power, as they have a powerful heater inside them to keep the sensing element warm (50 °C).
Data transfer
We used different solutions for data transfer. In the case of Caelibox 1 we had a dedicated server that collected data. The sensors communicated with the server via the Internet, using a basic REST API. The sent data were stored in a MySQL database, which could then be viewed on a web page.
In case of CaeliBox 2 we sent the data from all sensors to a server and they were then plotted. The platform was built using HTML, CSS (Bootstrap), Javascript (ApexchartsJS, HighchartsJS) and PHP for communicating with the server. It used Date/Time API to ensure that the data were time synced. The data were sent with an ESP8266 WiFi module, through an HTTP POST with a private key. The POST script had to match the ESP8266 code.
The students were very interested in creating the website, and in graphing and analysing the data.
- a larger number of measured parameters for a better analysis of air quality
- the latest generation sensors for low electric energy consumption
- the use of fewer but more complex lines of code
- the high storage capacity of measured data on a server
- quick access to data on our website [11]
- the database is accessible to anyone
- the increase of the values of the measured parameters over the allowed values can be observed in real time in the graphs
- it is an IoT device.
As can be seen in the table for the European Air Quality Index, all parameter data is measured in μg/m3 but for example the CO2 sensor gives the values in ppm and the TVOC sensor in ppb.
You can convert the sensor data units with this formula [12]:
concentration [mg/m3] = 0.0409 x concentration [ppm] x molar mass [g/mol]
The mean molar mass of the TVOC mixture is 110 g/mol and hence, 1 ppb TVOC corresponds to 4.5 µg/m3 [13].
During the measurement you can use standard devices for temperature, humidity and pressure to check the validity of the registered data and the sensors can be calibrated in a specialised institute for this process.
To choose the representative places for the measurements you must know which are the most polluted ones. Smog and soot come from the combustion of fossil fuels in cars and trucks, factories, power plants, incinerators, engines or from central heating systems in buildings. In a city, the first source of air pollution is transportation and the second is the housing sector, with respect to energy generation to provide heating and hot water [14].
You have to calculate the average parameter values and compare them using graphs. By collecting data in both cold and warm conditions, in very busy places or in quiet ones, you can clearly see how the pollution varies.
In each chosen place, the students measure the parameters over a period of 3-5 minutes (to have enough values for the average calculation), 2-3 times on the same day and on different days (warm, cold, dry or rainy days). On a cold and humid day, it is expected that the amount of dust will be smaller.
Who is to blame for the decreasing air quality?
The students can study the emissions for all modes of transport to find out which emissions have decreased and which have increased over the last 20 years. Then they can make documentation on the transport, e.g. in their own city or in the country's capital. The students should look for the main categories of vehicles, the fuel used and they can produce statistics about the emission of different pollutants or of the air quality index in their cities [9] [15]. To verify that transportation and the heating of buildings are the main culprits, students can complete a carbon footprint calculation [16] and then make comparative graphs.
Finally, the students make suggestions on how to decrease pollutants in their cities. For example, they can propose to go to school by bicycle or by scooter, formulate a law that forces drivers to turn off the engine when the car is parked, etc. Also they can study the impact of replacing cars with electric ones [17], or the use of solar panels and heating pumps for buildings.
Data processing through graphs
With CaeliBox 1 we made many measurements in different places in our city Cluj-Napoca. For example, you can see the difference between the values of the same parameters measured on and under the Manastur bridge, where many buses and cars pass. The particulate matter values and the CO2 concentration were greater under the bridge and that fact was predictable. On the bridge, the air currents decrease the concentrations while under the bridge the air stagnates. The TVOC and the noise values are comparable.
We made measurements in a polluted street in the morning during rush hour. You can find the variation of the concentration of CO2 and TVOC over about half an hour.
On the same day, the device was presented to some younger students and it ran in a classroom for 50 minutes. When the students saw so large values for both parameters they concluded that they should ventilate the classroom immediately.
This is how we realised that the analyser could also be used successfully for indoor measurements.
With CaeliBox 2 we recorded a lot of data. Here is an example for ozone and nitrogen dioxide values. All graphs can be seen on the website the students made. You can zoom into these graphs to get a shorter time frame for measurements.
If you analyse Graph 5, you can see that the concentration of particulate matter increases a lot on the street compared to the inside of the house (the first 15 measurements were made inside the house) and that all the three types tracked vary the same. The measurements made on the street vary, as high values appear when there are many cars in traffic.
The students can collaborate with students from other schools, where working groups can be set up, mentored by those who developed the analysers. Then a contest can be organised to find the best analyser. The students can enlarge their horizon, collaborating with students from other countries – to compare their analyses based on geographical, social or economic conditions.
The project can be presented to colleagues and an abstract can be put on the school website. Younger students can use the analysers. They can make more analyses in different places in the city and in this way, they can put more information about air pollution on the website[11]. They can use the new measured data to combine them and to display other graphs for their study.
A dissemination can be done through the media. The specialised services of the town hall must find out about what the students have achieved. They can co-opt them into real projects and thus students will become responsible citizens. An online webinar can be held for a national recognition.
Conclusion and outlook
The students involved in this project learn what air quality means and why it is so important to measure certain physical parameters in a sustainable city: temperature, humidity, atmospheric pressure, TVOC, CO2, PM1, PM2.5 and PM10, NO2 and O3. They find out how to design an analyser, how to choose the sensors, how to use Arduino, an open-source electronic platform based on easy-to-use hardware and software, and how to transfer and register the data. Then the students can apply their basic physics and chemistry knowledge to understand how the sensors work and finally draw different graphs to compare their collected data more easily.
The measured values that exceed the allowed limits are the effect of different pollution sources. The students have to find these sources and to propose solutions like drawing the mayor’s attention to the places where the traffic must decrease.
Throughout this project the students develop their ICT, hands-on and critical thinking skills.
The project can be improved: to use more accurate sensors, to make more analysers and to compare the data with those from scientific ones.
Authors of Smart Cities: Gerald Decelles III (NO), Corina Toma (RO), Panagiota Argyri (GR)
Links to forward to your students
1. Air Quality
J.G.Speight, Environmental Organic Chemistry for Engineers, ISSBN 978-0-12-804492-6, Elsevier, 2017, p.153-201.
https://airly.org/en/the-most-dangerous-types-of-air-pollution/ (May 2022)
https://www.breeze-technologies.de/blog/what-is-an-air-quality-index-how-is-it-calculated/ (May 2022)
An example: https://www.dwyer-inst.com/articles/?Action=View&ArticleID=83 (May 2022)
An example: https://towardsdatascience.com/sensing-the-air-quality-5ed5320f7a56 (May 2022)
https://www.history.com/news/the-killer-fog-that-blanketed-london-60-years-ago (May 2022)
https://airly.org/en/wildfires-consume-the-capital-of-greece-how-does-this-affect-air-quality/ (May 2022)
https://airly.org/en/summer-ozone-warning-in-europe-as-airly-reveals-the-summer-hotspots/ (May 2022)
https://ec.europa.eu/environment/air/quality/standards.htm (May 2022)
http://www.infonature.ro/ (May 2022)
https://www.teesing.com/en/page/library/tools/ppm-mg3-converter (May 2022)
https://www.catsensors.com/media/pdf/Sensor_Sensirion_IAM.pdf (May 2022)
Kaczmarczyk M., Sowiżdżał A., Tomaszewska B., Energetic and Environmental Aspects of Individual Heat Generation for Sustainable Development at a Local Scale—A Case Study from Poland, Energies 2020 13(2), page 454.
https://www.ventusky.com/ (May 2022)
https://www.transportenvironment.org/publications/explained-are-we-ready-switch-emissions-free-cars (May 2022)
Share this page