Climapse - Microcontroller Arduino
Overview
Overview
Keywords: data acquisition, microcontroller
Disciplines: Physics, mathematics, ICT
Age level of the students: 12-16 (This unit is for more advanced students that can wire different sensors and code in C++.)
![]()
![]()
![]()

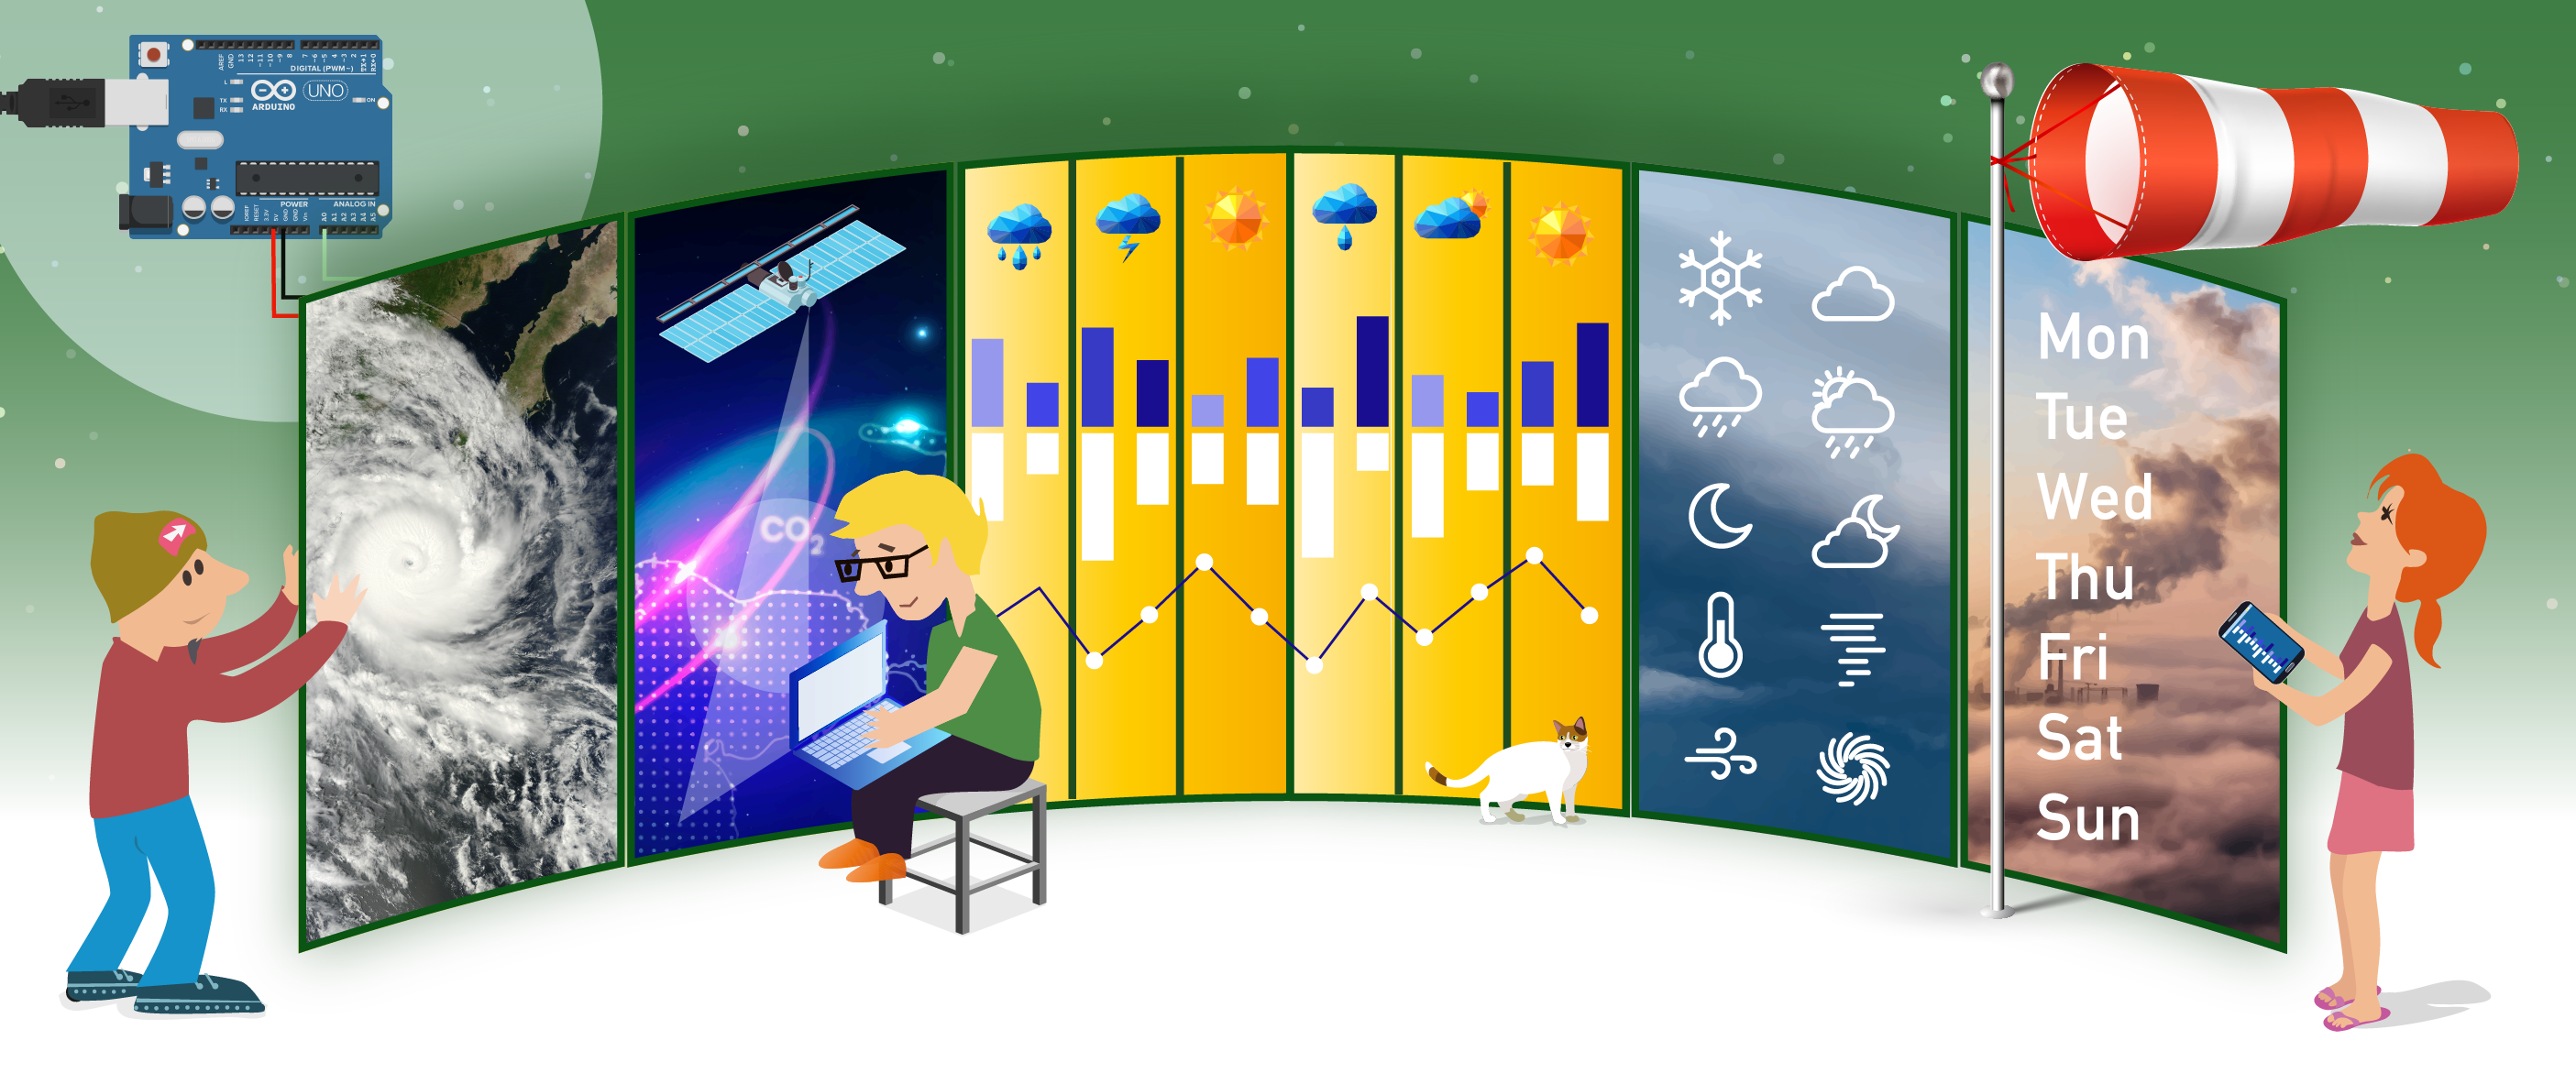
After showing some shocking data about atmospheric pollution or extreme weather events, the teacher presents the pupils the microcontroller used in the school and some sensors that will be implemented during the research. The microcontrollers used will do the same as the control units used by meteorological or environmental services, albeit in more sophisticated and complete ways.
Teachers then present the microcontroller used in the lab and the sensors used. After this, they focus on physical measurements made by sensors. They explain to the students how sensors measure physical quantities, how they transmit quantities to microcontrollers, how these quantities are converted into numbers, how the numbers are internally represented and how these numbers are handled on board of the units.
The data representation in graphs is then covered, stressing the importance of a representation of physical quantities versus time, to study parameters evolution and their influence on weather and pollution.
Parts needed
- Arduino UNO R3 or Arduino MKR WiFi 1010
- PC with Arduino.CC IDE Integrated Development Environment
- LM35 sensor with basic cables
- Any sensor you might consider useful
Importance of data
Students learn about the importance of data acquisition and storage.
The teacher needs to find a daily, monthly, or yearly evolution of environmental parameters such as CO2 / NOx / PMxx concentration levels. Useful online tools like the ESA EO Browser can be used to obtain a graphical image representation of these. A yearly evolution coverage might show lighter pollution conditions during the summer, heavier ones in rush times, and so on. The same time dependence could be found for rainfall, possibly heavy and persistent during fall and spring, sudden and violent during summer, showing impressive figures. At this point the students should understand the importance of data acquisition and storage. They will try and replicate, on a small scale, what international services like Copernicus do for the scientific community.
The teacher also stresses the importance of a continuous data acquisition, which is not interrupted during the day, allowing complete data history representation.
The control unit
Now the students are ready to start their main task: they will assemble a smaller replica of a meteorological/environmental control unit. We used the Arduino UNO R3 microcontroller for education, with temperature, barometric pressure, CO2 sensors. You can find a wealth of microcontrollers and sensors you can use for your classes; they are easy to be found and cheap.
You can easily find whatever you need to start coding with Arduino boards on the Arduino.cc website. Many examples and program skeletons are provided directly within the Arduino IDE, the software you need to install to be able to write the C++ code, download it with data to the physical Arduino unit and use it.
Whenever you start a new Arduino C++ program, the skeleton of the code is immediately provided by the IDE: a setup section and a loop section. The setup is run only once at the system power-up and is used to set up the devices and sensors you will use. The loop, as you might imagine, is actually what guarantees that Arduino will continuously perform the data acquisitions you need during each given day, if you continue powering it. You can count on the continuous execution of the instruction code within the loop brackets.
void setup() {
// put your setup code here, to run once:
}
void loop() {
// you put here your data acquisition code, to run repeatedly:
}
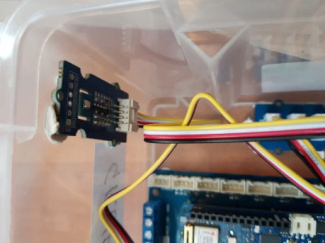
Now it’s time to connect a sensor to your microcontroller. We can use the very well-known LM35 temperature sensor as an example. It samples the external temperature and transmits a voltage value to Arduino via an analogue pin input: you’ll find the analogue input pins labeled A0…A5 in the lower-left corner in the picture below. We chose A0 to connect the sensor. Have a look at the pictures below to see the easy connections scheme.
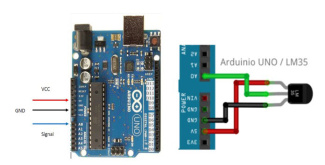
The sensor might look different from the one you have, but don’t worry: you always get 3 wires to be connected to the Arduino board.
After that you just need to write the code using Arduino IDE you installed: you can copy and paste the following code:
void setup()
{

Serial.begin(9600);//Set Baud Rate to 9600 bps

pinMode(LED_BUILTIN, OUTPUT);
}
unsigned int intdelay=1000; wait 1000 ms
void loop()

{
void setup()
{
Serial.begin(9600);//Set Baud Rate to 9600 bps
pinMode(LED_BUILTIN, OUTPUT);
}
unsigned int intdelay=1000; wait 1000 ms
void loop()
{
uint16_t val;

double dat;

digitalWrite(LED_BUILTIN, HIGH); // turn the LED on (HIGH is the voltage level)

val=analogRead(A0);//Connect LM35 on Analog 0

dat = (double) val * (5/10.24); // Vref on UNO 5.0 V

Serial.print("Temp:"); //Display the temperature on Serial monitor

Serial.print(dat);

Serial.println("°C");

delay(intdelay); // wait for a second

digitalWrite(LED_BUILTIN, LOW); // turn the LED off by making the voltage LOW
}
Now we focus on the red highlighted instruction:
It means that for any given loop the Arduino will read the value input from the sensor to the analogue input A0 and will store the read value in the variable val, where it will be available for you. It will be a number between 0 and 1023. How come a temperature was converted into this apparently odd number? Well, to answer we need to focus on what happens to the temperature measurement.
Magic numbers
You usually get a physical quantity from modern sensors via an indirect measurement: often a physical quantity is measured through a change in electrical or electronics proprieties. Change in conductivity, resistivity, or other electric characteristics usually take to a different voltage brought to the Arduino analogue pins. This is why your sensor will generate a voltage through A0 between 0 and 5 V, the scale Arduino can measure. Right after that the “analogRead (A0)” command highlighted in red converts the input voltage range, 0 to 5 volts, to a numeric value between 0 and 1023. This is done by a circuit inside the microcontroller called an analogue-to-digital converter or ADC. The voltage read is transformed by the ADC into a number representable with 10 bits. Here below some numeric examples.
The number 0
|
position |
9 |
8 |
7 |
6 |
5 |
4 |
3 |
2 |
1 |
0 |
|
digit val |
0 |
0 |
0 |
0 |
0 |
0 |
0 |
0 |
0 |
0 |
The number 28+28+28+28=256+32+4+1=293
|
position |
9 |
8 |
7 |
6 |
5 |
4 |
3 |
2 |
1 |
0 |
|
digit val |
|
1 |
|
|
1 |
|
|
1 |
|
1 |
The number 1023 = 210-1
|
position |
9 |
8 |
7 |
6 |
5 |
4 |
3 |
2 |
1 |
0 |
|
digit val |
1 |
1 |
1 |
1 |
1 |
1 |
1 |
1 |
1 |
1 |
Now you’re almost there. You just need to convert the number into a consistent temperature value.
Usually, when you buy a sensor, you get a manual called "data sheet". In the LM35 data sheet you can find that the resolution of the LM35 is 10 mV/°C, which means that for any variation of 10 millivolts in the input signal you get a variation of 1 °C. Since the input signal is a number 0-1023 you just need to calculate 5V/1024=0.00488 V per IN unit, i.e. 4.88 mV per unit, the variation brought by a single step. The use of 1024 in the division is due to the 1024 symbols available from 0 to 1023. This resolution means that the sensor accuracy is 0.5 °C. Not that much, but it’s enough for our application. To give an example, if we get the number 50 unit as signal in, it will take you to a temperature value of 50X4.88 mV=244 mV. With 10 mV/°C, this means 244/10=24.4 °C. Easy! This should explain the instruction
dat = (double) val * (5/10.24); // Vref on UNO 5.0 V
(where 5/10.24 = 0.488 are degree centigrade per digital step) with which you should get in dat the temperature (in Celsius) you wanted. Now you’re ready to use your value: you can store it onboard or send it through the serial monitor.
Fine tuning the Arduino
The instruction delay(nnn) tells Arduino to wait without doing anything for “nnn” milliseconds. There are quantities that have to be sampled every hour, other quantities once per day, others with a higher frequency. You can use this instruction to fine tune the data acquisition refresh, by making inner loops in the main loop that are active only for multiples of the shorter delay. See the example provided. To be sure that the pupils have correctly understood the meaning of refresh frequency, let them build their own refresh frequency strategy.
Getting the data out of the Arduino
Now you have the numbers, and you are ready to get them out of the Arduino and graph them.
The easiest and quickest way to get your data is to store them on a SD card. You can plug an SD card onto the Arduino. An SD card is largely seen by the microcontroller as a file and is treated as such. You need to define it, open it, write on it, and close it before exiting the application. If you don’t know how to use a file, don’t worry. The Arduino website provides even a complete ready to use library (ready-to-use instruction directly available in your application code) with a “how to use it” guide.
Example code
You can copy and paste the example below to the Arduino IDE editor, or you can find it in the Arduino Project Hub cloud.
/*
Climapse Science on Stage

Example of atmospheric parameter read through sensor

Reads temperature on Analogue In A0, prints the result to the Serial Monitor

Issue a light alarm with red LED if temperature greater than 30

This example code is in the public domain.
*/
void setup()

{
Serial.begin(9600);//Set Baud Rate to 9600 bps for serial monitor data TXRX

pinMode(LED_BUILTIN, OUTPUT); // Built In LED also digital out #13

pinMode(7, OUTPUT); // Pin 7 used as digital output to issue a visible warning via the LED
}
void loop()

{
uint16_t val;

double dat;

digitalWrite(LED_BUILTIN, HIGH); // built in led used as loop blinker

val=analogRead(A0);// Be sure to connect LM35 sensor on Analog 0

dat = (double) val * (5/10.24); // conversion to degrees centigrade

Serial.print("Temperature : "); //Display the temperature on Serial monitor

Serial.print(dat);

Serial.println("C");

if (dat > 30.0)
{

digitalWrite(7, HIGH); // LED on

}
else
{

digitalWrite(7, LOW); // LED off

}
delay(300);

digitalWrite(LED_BUILTIN, LOW); // to show that loop is running regularly

delay(200);

}
Sensor multiplication
Once you have connected one sensor that provides Arduino with an analogue signal, you can connect many other sensors to obtain other physical quantities. The working principle is very much the same, you will get an analogue signal, that will be converted to a 10-bit numeric value. Then you will use the data sheet to get the sensor resolution and the sampling accuracy. Tell the students to do the same task with a barometric pressure sensor, with an air quality sensor, and you’ll have your application ready to run in a location of your choice where it is meaningful to acquire physical quantities data.
Additional activity
The Arduino MKR WiFi 1010 is a board of the Arduino family using "Grove" type connectors and offering an onboard built WiFi connection feature. It can be used with its connector shield, the Arduino MKR Connector Carrier, to make it easier to plug in the sensors with the standard "Grove" quick connection.
When the students feel more confident with the Arduino board and its sensors, you can try this program, with sensors for temperature, humidity, barometric pressure and PM dust. We installed this application with some units inside our school.
The application sends data to a server inside the local WiFi network. You need libraries to be included in the Arduino IDE, but including libraries is extremely easy.
All the details about this project are to be reached in the Arduino Project Hub.

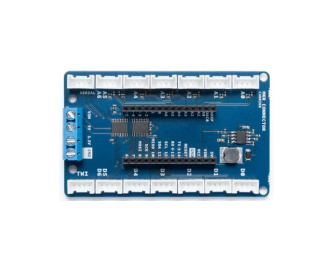
Arduino MKR Connector Carrier
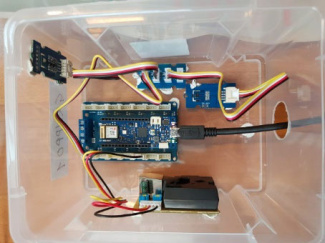
The Arduino MKR WiFi 1010 in the atmospheric monitoring application
A sensor detail: the used Arduino MKR WiFi 1010 in the atmospheric monitoring application.
Authors of Climapse: Johannes Almer (DE), Marco Nicolini (IT), Teresita Gravina (IT)
Share this page