Climapse
Overview
Overview
Keywords: Climate change, meteorology data acquisition, data acquisition, microcontroller, global warming, glacier, climate history, air quality, geographical data comparison, satellite data usage
Disciplines: Earth science, biology, physics, mathematics, ICT
Age level of the students: 12-16
Time frame: depending on the activity between 45 minutes and several school lessons
![]()
![]()
![]()
Go directly to:
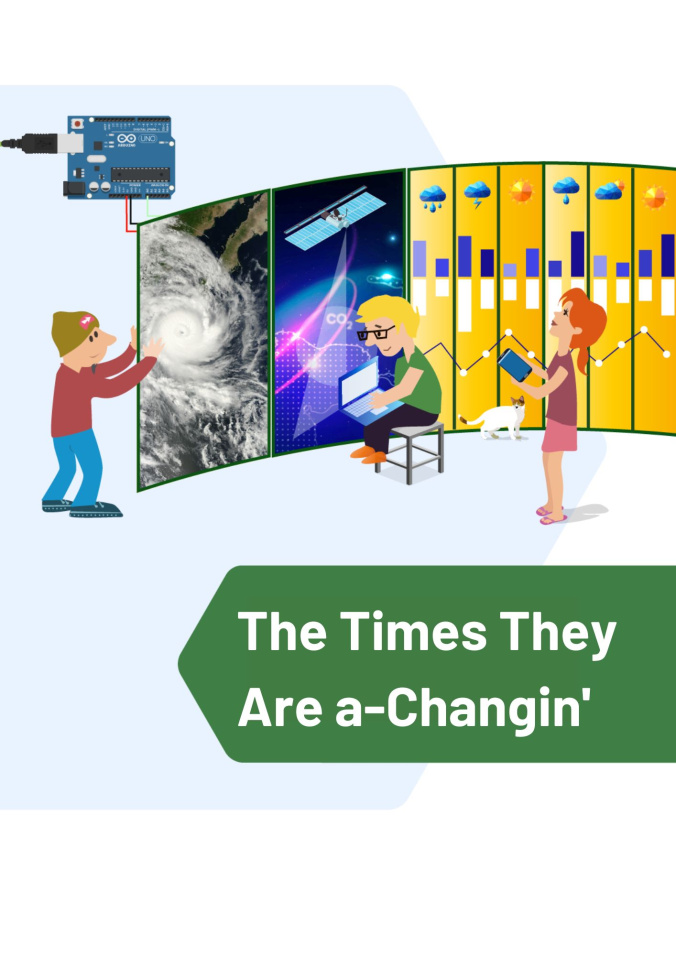
Introduction - The Times They Are a-Changin'
Microcontroller Arduino
Microcontroller micro:bit
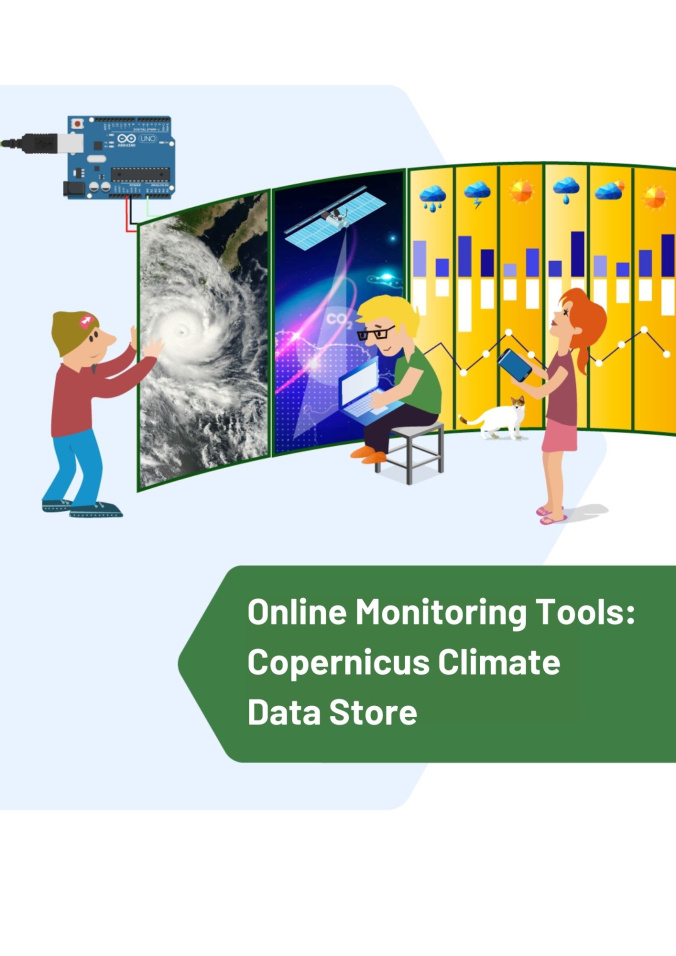
Online Monitoring Tools: Copernicus Climate Data Store
Online Monitoring Tools: EduMed and EO Browser
Take Action
You can also find an insight into the unit directly from the authors in this webinar (YouTube).
Summary
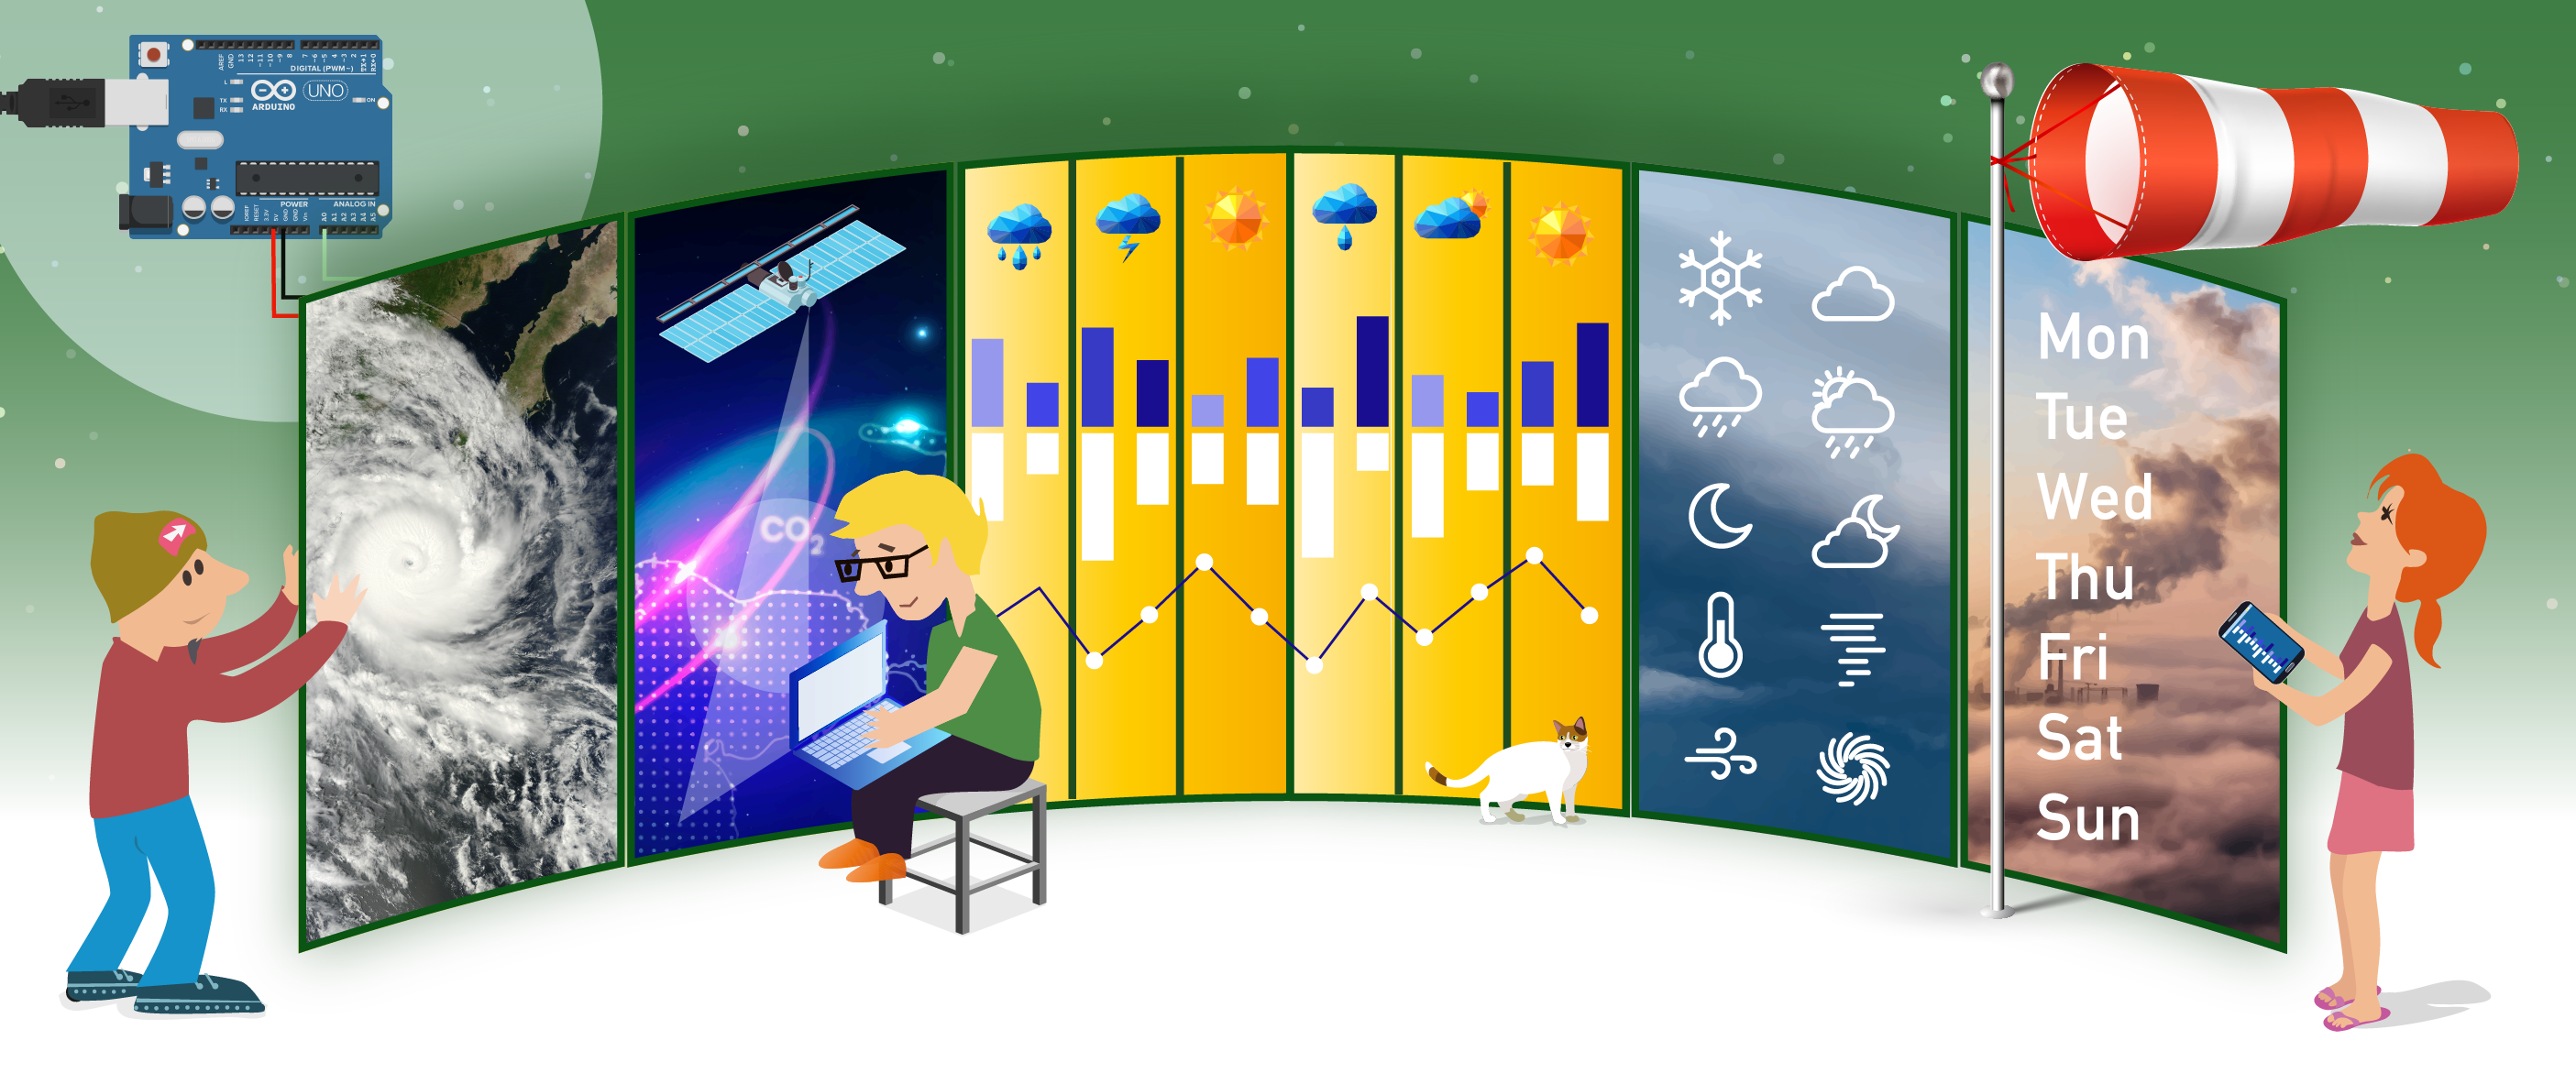
Climapse is a blend of climate and timelapse. This teaching material consists of three parts which can be combined individually for different age groups and depending on the available equipment. The material first raises awareness of the strong signs of climate change and its impact in Europe using timelapses. Following this, students can work as scientists by gathering their own data with microcontrollers and by analysing scientific data and satellite imagery to create their own time series.
This should lead students to take action for their future based on their scientific findings.
Ask the authors
The unit is based on a primary module to raise awareness of the problem. It is hard to observe climate change by simply comparing subsequent years. But if you look on a slightly larger scale it is easy to see drastic changes all over Europe, such as melting glaciers, and more frequent tornadoes due to higher average temperatures.
This will be covered in the introduction to the unit which is followed by different lessons and their various activities which can be combined flexibly.
Introduction - The Times They Are a-Changin'
When weather is averaged over 30 years, we call it climate. This very rough definition shows the problem already. The time period is long for us but very short for our Earth. The following unit shows students the visible effects of climate change in Europe and helps them to recognise recurring weather phenomena as signs of the human-driven climate change.
The lesson begins with a shocking video about tornadoes and their destructive power in Modena, northern Italy. Students see that here in Europe we are directly affected by the increase of extreme weather conditions, that were uncommon in the past. This introduction is followed by interactive exercises that raise awareness of different aspects as a consequence of climate change.
This will include extreme weather conditions like heavy floods as well as geographical and biological indications. The exercise shows the melting glaciers in Europe and the effect of earlier blooming due to warming. We tried to use examples all over Europe to show the implication for us all.
The lesson ends with large scale phenomena shown by the climate time machine from NASA. This will make it clear that saving our local environment will save our earth.
Microcontroller
Students learn how to use microcontrollers for gathering their own data. They can acquire data and create their own time series to prove climate change. As a teacher you have two options, depending on your equipment and the age of the students.
Microcontroller Arduino
The Arduino unit is the more advanced option for older students. You have the advantage of a broad range of sensors and many schools already have the equipment. This is especially recommended if you want to emphasise the air quality and combine this unit with the EO Browser, as proper sensors are available for Arduino.
This unit is for more advanced students that can wire different sensors and code in C++.
The teacher introduces the importance of numbers in climate and meteorology, how meteorological events can be described through data variations in time, and how atmosphere pollution can be controlled through concentration numbers. The teacher motivates the students with shocking figures about atmospheric pollutions, strong winds that caused damages, or other impressive figures.
The focus is then shifted towards numbers. How can we quantify and express quantitative measures on physical quantities that contribute to describe event and their range? The need for definition of physical quantities, together with their units is presented. Their usefulness in terms of scientific community interchanges is stressed.
The teacher then introduces automatic data acquisition systems, how they work, how they guarantee a continuous uninterrupted data acquisition and data flow. The way a physical quantity is measured by microcontrollers and sensors is then presented to the students.
Next, the teacher explains how a physical atmospheric quantity is converted into a number and then into a physical unit measure in a microcontroller (here we used Arduino UNO R3).
Following on from this, the teacher presents the way data can be stored on a microcontroller for education, and how they can be analysed.
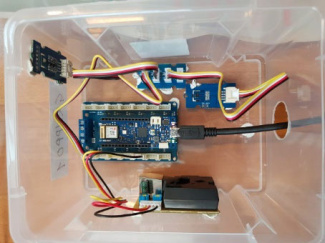
The Arduino MKR WiFi 1010 in the atmospheric monitoring application
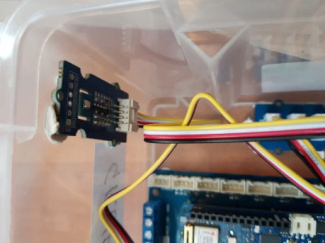
A sensor detail: the used Arduino MKR WiFi 1010 in the atmospheric monitoring application.
Microcontroller micro:bit
The micro:bit is a simple device that can be programmed using blocks and is very intuitive. You can do this part without any hardware by utilising a virtual simulation, but using real microcontrollers is recommended. There is also an activity for collaborative work with a sending and a receiving unit to engage students in group work.
Built-in temperature sensors
In this task, students log the data from the built-in temperature sensors as a starting point. As a result, they do not have to wire any external sensors.
External temperature sensors
The second task with the micro:bit is using a cheap external sensor. This is more challenging, as students have to consider aspects such as including an external library to read the data from the sensors and how to wire the external device correctly.
Online Monitoring Tools - Copernicus Climate Data Store
Copernicus gives you access to lots of atmospheric data like average temperature 2 m above ground and is controlled by simple Python programming within the browser.
Copernicus Climate Data Store (CDS) is a freely available database for exploring the Earth's past, present and future climate. You can register and obtain access to the CDS and its toolbox.
Students learn how to access meteorological data for specific events (time frame and location) and how to plot this data using Python.
Online Monitoring Tools - Edumed and EO Browser
This part covers two more webtools for meteorological data.
The EduMed website offers a time machine for weather conditions all over Europe to analyse especially single events, such as floods or tornadoes.
To analyse air quality, EO Browser offers you a convenient website where you can adjust the parameters graphically and extract the data.
EduMed is offered by the Université Côte d’Azur, France, for educational purposes. It is a wonderful, easy-to-use, powerful tool that allows the analysis of a great number of atmospheric parameters. The great thing is that you can find events back in time. The teacher needs to explain the correlation between the shown parameters and the weather recorded on extreme event day.
The EO Browserby ESA makes it possible to browse and compare full resolution images from the complete archive of Sentinel-1, Sentinel-2, Sentinel-3, Sentinel-5P, ESA’s archive of Landsat 5, 7 and 8, global coverage of Landsat 8, Envisat Meris, Proba-V, MODIS and GIBS products. You can choose between different areas of interest, select a time range and analyse data from different sources.
Take Action
The teacher encourages the students to present their research to the school or the city community, giving explanations of what happened using the data they obtained from the service. The main point of this activity is to help students communicate scientific data in effective ways using the correct approach; formal or informal.
This activity is also an opportunity to underline that sharing reliable information is a good way to avoid misinformation. The next step of this activity will be to collect all the data analysed by teachers and students all around Europe to see what is happening in different place. If you want to share your results with us you can share it via Twitter using #ClimpaseSDGs.
Authors of Climapse: Johannes Almer (DE), Marco Nicolini (IT), Teresita Gravina (IT)


Share this page