Climapse - Online Monitoring Tools: Copernicus Climate Data Store
Overview
Overview
Keywords: Climate change, meteorology data acquisition, global warming, climate history, geographical data comparison, satellite data usage
Disciplines: Earth science, physics, mathematics, ICT
Age level of the students: 12-16
Time frame: flexible
![]()
![]()
![]()

The teacher needs to identify an extreme weather event (heavy and continuous rains, strong wind, heavy snowfalls, tornado, …) that took place in the region where the school is. The closer the event was, the stronger the students’ motivation will be and the more effective the study will be on students’ minds. The students then look for evidence, such as pictures, videos, newspaper articles, reports and stories that covered the event and then search data about this event using a web tool.
The main idea is to help students to create "case studies" using all the data they find with these different tools. In this way, they will be able to find some proof of climate change that can be shared with their peers. A strict correlation between extreme weather events, environment pollution and climate change hasn’t yet been scientifically proven, although evidence strongly suggests it. In any case, there is no doubt that the rising frequency of these events, the pollution and the anthropic activities are connected, which is why teachers should encourage their students to investigate this topic with a clear, curious and scientific mind.
Introductory activity
The students, autonomously, look for other materials concerning the event. They interview people they know about the event, ask for pictures, videos, stories, etc.
First steps with the Toolbox Editor
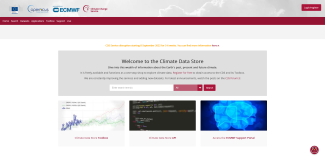
Now students use a powerful tool, the Climate Data Store in the Copernicus European Union Earth Observation System. The best tool for your class will be the Climate Data Store Toolbox, which is why you will select this service and then click the Toolbox Editor.
At this point, if you didn’t register, registration is required which is totally free of charge. You can register and let a few students, i.e., one for each group, do the same. You are now ready to go; your dashboard is here, and you will work in this Application Integrated Environment, so there is no need to access other web pages.
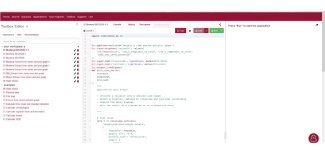
There is no need to install any program on your computer as you will be working online, even though you might want your locally-installed application, and you can install an API later. In the left column, you can see the workspace where you will find the application you designed, the examples and all your files. In the central area is a Python program. It is not necessary to understand exactly each syntax detail. We examine here the important features your students need to get meaningful time series.
Specify the location
First of all, latitude and longitude. Students replace the default numbers for latitude and longitude with the exact geographical coordinates of the location where the weather event occurred or where the school is.
@ct.input.text('longitude', type=float, default=10.9202)
@ct.input.text('latitude', type=float, default=44.6568)
Specify the research parameters
Then, at the very beginning of the code, you will find the lines specifying the parameters you want to get from this research:
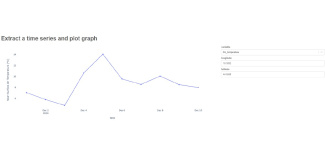
@ct.application(title='Extract a time series and plot graph')
@ct.input.dropdown('variables', values=['2m_temperature', '10m_u_component_of_wind', '10m_v_component_of_wind', 'mean_sea_level_pressure')
In this example '2m_temperature' (temperature 2m above the ground), '10m_u_component_of_wind' (east-west wind), '10m_v_component_of_wind' (north-south wind), 'mean sea level pressure' are listed as "dropdown windows". There are other variables available, just have a look at the help section and parameters list and names. These are the parameters you will get plotted by this application.
Specify the time reference
You now just need to specify the time reference for which you want the data plotted, you can specify years, months, days, times.
# Time range
data = ct.catalogue.retrieve(
'reanalysis-era5-single-levels',
{
'variable': variables,

'grid': ['3', '3'],

'product_type': 'reanalysis',
'year': [
'2008', '2009', '2010',

'2011', '2012', '2013',

'2014', '2015', '2016',

'2017'
],
'month': [
'01', '02', '03', '04', '05', '06',

'07', '08', '09', '10', '11', '12',
],
'day': [
'01', '02', '03', '04', '05', '06',

'07', '08', '09', '10', '11', '12',

'13', '14', '15', '16', '17', '18',

'19', '20', '21', '22', '23', '24',

'25', '26', '27', '28', '29', '30',

'31'
],
'time': ['00:00', '06:00', '12:00', '18:00'],
}
)
You are now ready to ask the system for the data you need and tell it you want them plotted. You do this just by clicking Run after saving (Save) your program.
Now you have to consider that many people all over the world could be asking the Copernicus system for data simultaneously, so the time you have to wait can be some seconds or maybe one minute, but eventually, you will get your data plotted, as in the following image. With the sliders below the graph, you can change the visualised data. You can even ask the system to open the application in an independent, larger window where you can better observe and analyse your data.
And that’s it! The Copernicus Climate Data Service tool is completely at your disposal. And your students got also a first impression of Python!
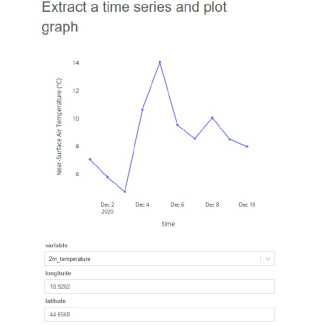
With the sliders below the picture, you can change the visualised data.
Application opened in independent, larger window
Getting data and graphs
After making some exercises with the students you now invite them
- to fill the
latitudeandlongitudespaces with the exact data referring your location(s); - to specify dates (
year,month,dayandtime) when the weather event you want to analyse occurred, most likely in the specific place we examined in previously. If a variation of some parameters is needed (temperature comparison for instance), they might want to specify the day before and the day after the event); - and finally, the students have to specify the parameters they want to plot.
They are now ready to run the program, wait a few seconds, and get the graphs they need. The data plotted versus time will be a meaningful way of studying variation of parameters, which are the most important events occurring in meteorology or climate studies.
Should any change be needed in the Python code, remember to instruct them to save the new code with a new name. In the leftmost column, any program they edited will be listed and saved for future usage if the user is registered.
The students can easily grab the graphs with a screen capture.
Observation and analysis
Now the students have their graphs. You can guide them in a journey through time, to locate the weather events they wanted to get, with the help of the parameter’s variations.
You can invite them to examine the temperature graph and you ask them the following questions:
- Is the temperature constant in time? How can you tell this?
- When was the temperature increasing? When was it decreasing? When did the temperature peak?
- Can you locate a day when a strong wind was blowing? Which was its prevalent direction? Could this mean an increase in temperature?
- Examine the pressure graph. Do you see any change in pressure? What could this mean?
- Can you spot a sudden drop in atmospheric pressure? What does this mean?
One of the activities done with students was to look back for a heavy flood due to heavy rains and warm wind. They could find in the two preceding days a sudden rise in temperature in the mountains with a rapid snow melting, followed by three days with heavy rains, and a strong wind from the south, carrying warm air. And this was enough to find a reason for what happened.
Authors of Climapse: Johannes Almer (DE), Marco Nicolini (IT), Teresita Gravina (IT)
Share this page