Smart Cities - Air Pollution

Overview
Overview
Keywords: smart cities, data acquisition, sustainable development, databases, air pollution
Disciplines: physics, environmental science, general science, biology, geography
Age level of the students: 11-18
Time frame: flexible, one to several lessons
Partners: research laboratories, local community
![]()
![]()

Introduction
Teachers need to explain to their students what air pollution is based on scientific articles, what the causes of the phenomenon are and why it is important to study this. Teachers need to highlight the effects of air pollution to the environment and to human health. To achieve this, teachers ask students to search for scientific articles or scientific evidence. An example is [1], [2].
Air pollution can be defined as a change in air quality that can be characterised by measurements of chemical, biological or natural pollutants in the air. The air pollution problem is concerned with the undesirable effects produced by excessive atmospheric pollutants. The effects form three basic types: nuisance, economic and health [3]. Therefore, air pollution is essentially the release of pollutants harmful to human health and to the entire planet or an abnormal increase in the proportion of certain components of the atmosphere.
- Particulate matter (PM) is an air pollutant consisting of a mixture of solid and liquid particles suspended in the air.
- PM can either be directly emitted into the air (primary PM) or be formed in the atmosphere from gaseous precursors (mainly sulphur dioxide, nitrogen oxides, ammonia and non-methane volatile organic compounds [NMVOCs]).
- Primary PM and the precursor gases can have anthropogenic and nonanthropogenic sources.
- Commonly used indicators describing PM refer to the mass concentration of PM10 (particles with a diameter <10 μm) and PM2.5 (particles with a diameter <2.5 μm). Part of PM2.5 and PM10 comprises ultrafine particles with a diameter <0.1 μm.
- PM between 0.1 μm and 1 μm in diameter can remain in the atmosphere for days or weeks and thus be subject to long-range cross-border transportation.
- The most important chemical constituents of PM are sulphates, nitrates, ammonium, other inorganic ions such as Na+, K+, Ca2+, Mg2+ and Cl–, organic and elemental carbon, crustal material, particle-bound water and heavy metals.
It is increasingly recognised that air pollution is transported on mid-latitude westerly winds from Eurasia to the Pacific Ocean basin and across to North America. This trans-Pacific pollution reaches North America and may have substantial impacts on ecosystems and climate. Air pollution is categorised into the following.
- Pollution of the outdoor area includes the exposure of pollutants outside the built environment. Particles produced by the burning of fossil fuels, harmful gases, soil ozone and tobacco are examples of outdoor pollution.
- Indoor pollution includes the exposure of particles, carbon oxides and other pollutants transported by indoor air or dust. Carbon monoxide gases, radon, chemicals, building materials (asbestos, formaldehyde), allergens, tobacco, mould and pollen are examples of indoor pollution. In some cases, outdoor pollution can be turned into indoor pollution through windows and ventilation. [4]
Although official efforts to control air pollution have traditionally focused on outdoor air, it is now apparent that elevated contaminant concentrations are common inside some private and public buildings.
Concerns about potential public health problems due to indoor air pollution are based on evidence that urban residents typically spend more than 90 percent of their time indoors, concentrations of some contaminants are higher indoors than outdoors, and for some pollutants personal exposures are not adequately characterised by outdoor measurements.
Among the more important indoor contaminants associated with health or irritation effects are passive tobacco smoke, radon decay products, carbon monoxide, nitrogen dioxide, formaldehyde, asbestos fibres, micro-organisms, and aero-allergens.
Efforts to assess health risks associated with indoor air pollution are limited by insufficient information about the number of people exposed, the pattern and severity of exposures, and the health consequences of exposures. An overall strategy should be developed to investigate indoor exposures, health effects, control options, and public policy alternatives [5], [6].
Air pollution in different countries
In this part, students investigate how air pollution appears in different countries through real statistical data and graphical representations.
Teachers ask their students to investigate and compare real data for greenhouse gas and CO2 emission in Europe.
The following databases provide graphical representation:
Our World in Data, with a database for greenhouse gas
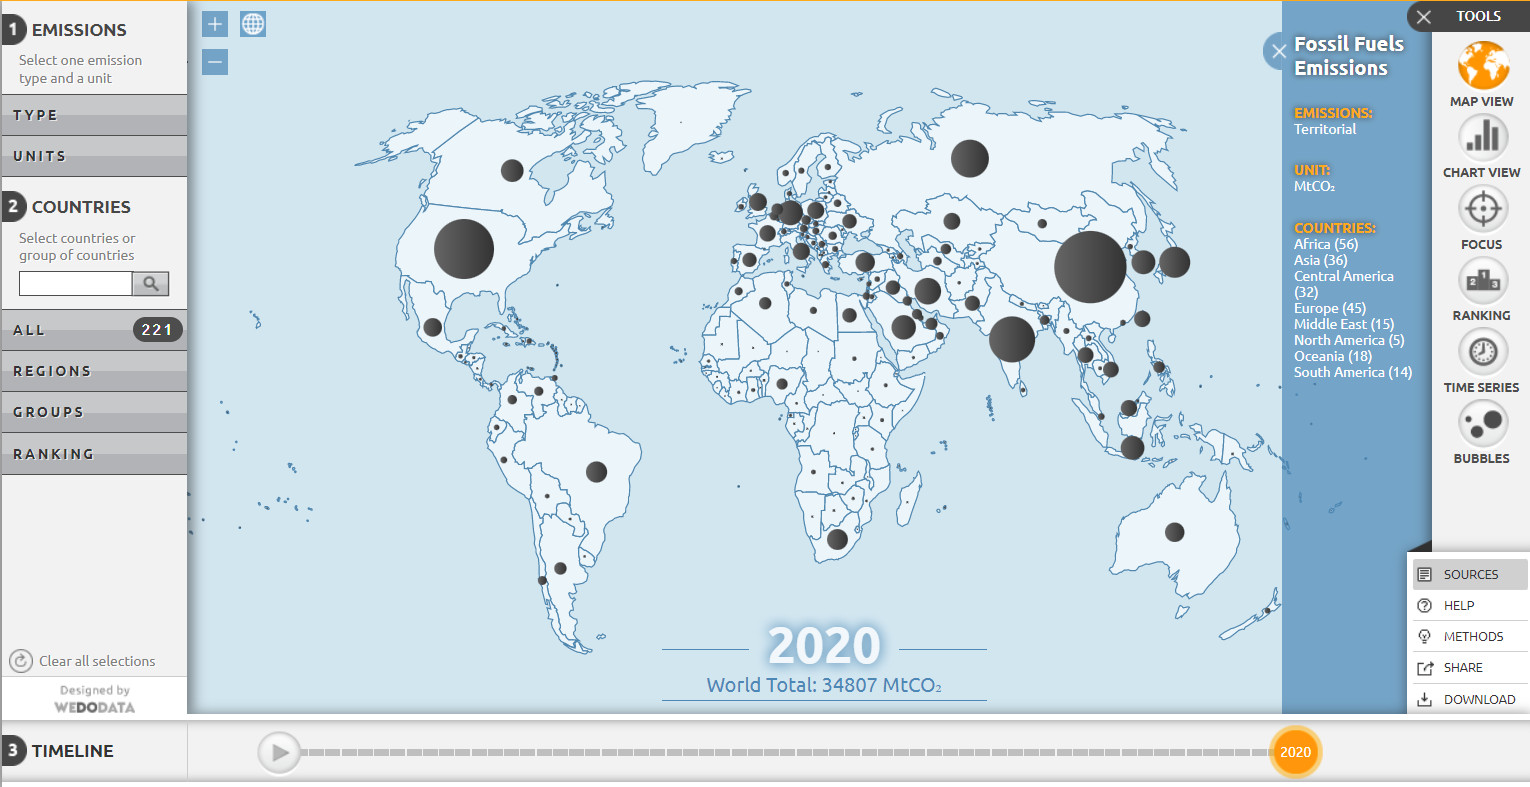
Global Carbon Atlas, with a database for CO2 emissions
Teachers can look for data from their own country. Every country profile in Our World in Data includes five sections.
- CO2 emissions: How much does a country emit each year? What are the average emissions per person? How much has the country emitted over time? How do emissions for a country compare when we correct for traded goods?
- Coal, oil, gas, cement: How much CO2 comes from coal, oil, gas, flaring or cement production?
- Other greenhouse gases: What are the total greenhouse gases emitted by each country? How much methane, and nitrous oxide is emitted?
- Emissions by sector: Which sectors contribute most to emissions? Does transport contribute more or less than electricity? How large are agriculture and land use emissions?
- Carbon and energy efficiency: How much energy do we use per unit of GDP? How much carbon do we emit per unit of energy?
Example activities and how to use the databases
Modern research has shown that a new biofuel made from wood helps reduce carbon dioxide emissions. In fact, some companies have dedicated themselves to the sustainable management of forests for the production of the first such biofuel.
- Carbon dioxide emissions in Greece increased every year until 2008 and since then they have been decreasing until today.
- The change in carbon dioxide emissions each year is about 4% down from 2008 to date.
From the map of world CO2 emissions, we observe that Greece is ranked 51st in the world ranking (in 2019), while the first place is held by China, followed by the USA and then India and Russia.
The peak of annual CO2 emissions is observed in 2007 (114.59 million tonnes), while the peak of emissions based on consumption is observed in 2002 (112.23 million tonnes).
Between the years 2002-2003, 2008-2009 and 2010, the annual emissions are almost equal to the emissions based on consumption.
From the graph you can see that between 1990 and 2002, consumption-based emissions increased (around 16.6% increase) and were higher than annual emissions. Between 2002 and 2009 there is a decline and then a return of emissions based on consumption. From 2010 onwards there is not only a vertical decrease (approximately 73.7% decrease), but they are also higher than annual emissions. This means that production is higher than consumption.
- From 1949 to 2017 emissions per person increased by 6.75 tonnes (from 0.11 tonnes to 6.86 tonnes, i.e. by 6136%).
- From 2001 to 2011 emissions per person increased by 4.18 tonnes (from 2.64 tonnes to 6.82 tonnes, i.e. by 158% each year (on average) this decade).
- From 2011 to 2017 CO2 emissions increased by only 0.2 tonnes per person, while total emissions are around 10 billion tonnes per year.
- Research question: what is the reason for the rapid increase in CO2 emissions in the decade 2001 - 2011 and where is their stabilisation in the next decade?
From 1978 onwards, China increasingly began to promote industrialisation and urbanisation. This rapid industrialisation, which peaked at the beginning of the 21st century, was the reason why carbon dioxide emissions increased with devastating consequences for the country.
Over the past decade, humanity has begun to pay attention to environmental protection, so China has taken steps to stabilise its emissions under pressure from a large number of developed countries. In fact, in the Copenhagen pact on climate change of 18th December 2009, China set the ambitious goal of reducing CO2 emissions by 40-45% by 2020, which unfortunately was not achieved even by a small percentage [7] .
Selected countries: Spain, Portugal, Greece, Germany, Ghana
Country selection criteria: Spain and Portugal are neighbouring countries, so it would be interesting to see if and what the differences are. Greece is a Mediterranean country like the previous two, but not their neighbour and much smaller in size. Germany is a large country, known for its economies of scale and technological development / activity. Finally, Ghana is a developing country, so it would be interesting to study the environmental impact of a country of this industrial scale.
Chart study period: 1800-2020
Carbon footprint
A carbon footprint is the amount of carbon dioxide (CO2) emissions associated with all the activities of a person or other entity (e.g., building, corporation, country, etc.). It includes direct emissions, such as those that result from fossil-fue combustion in manufacturing, heating, and transportation, as well as emissions required to produce the electricity associated with goods and services consumed.[8]
Our daily way of life has a huge impact on our planet. Day by day, CO2 emissions are created by driving cars, heating, cooking, working, celebrating and flying.
Teachers ask students to use an online calculator (e.g. UN carbon footprint calculator, carbon footprint calculator) in order to estimate their impact on global warming over a period of 12 months.
They can select their daily habits:
- Amount of total energy used in the house
- Flight itineraries
- Transportation (car, motorbike, bus and rail)
- Food and drink products, computer and IT components etc.
To conclude, the students can research ideas on how to reduce their carbon footprint.
You can see all the steps for using a carbon footprint calculator here
Authors of Smart Cities: Gerald Decelles III (NO), Corina Toma (RO), Panagiota Argyri (GR)
Links to forward to your students
Joint, W. H. O., & World Health Organization. (2006). Health risks of particulate matter from long-range transboundary air pollution (No. EUR/05/5046028). Copenhagen: WHO Regional Office for Europe.
H. H. Schrenk Ph. D (1952) A Scientist Views the Air Pollution Problem, Air Repair, 2:1, 17-22, DOI: 10.1080/00966665.1952.10467563.
Kenneth E. W., Leonard A. B., Marilyn E. (2000). Trans-Pacific Air Pollution. Science Vol. 290, Issue 5489, pp. 65-67.
Spengler, Sexton, K. (1983). Indoor air pollution: a public health perspective. Science: Vol. 221, Issue 4605, pp. 9-17. DOI: 10.1126/science.6857273
Μarinou M., & Argyri, P. (2020). Air Pollution: What are perspectives of Greek students? Open Schools Journal for Open Science, 3(3).
https://en.wikipedia.org/wiki/Copenhagen_Accord#Emissions_pledges (May 2022)
Encyclopædia Britannica https://www.britannica.com/science/carbon-footprint (October 2022)
Our World in Data (database for greenhouse gases): https://ourworldindata.org/co2-and-other-greenhouse-gas-emissions#how-do-we-measure-or-estimate-co2-emissions
Global Carbon Atlas http://www.globalcarbonatlas.org/en/CO2-emissions
UN carbon footprint calculator https://offset.climateneutralnow.org/footprintcalc
carbon footprint calculator https://calculator.carbonfootprint.com/calculator.aspx?tab=2
Share this page