Smart Cities - Energy for Tomorrow

Overview
Overview
Keywords: smart cities, data acquisition, energy, sustainable development
Disciplines: mathematics, physics, environmental science, general science
Age level of the students: 14-18
Time frame: 2 x 45 minutes
Partners: It is possible to partner with schools in neighbouring cities, though this is not a requirement on the project.
![]()
![]()
![]()

Research question
Can we generate enough energy through renewable means (solar) to power our cites?
Data that you will need to answer this question
- The current (or most recent data set) energy consumption of the city you have chosen in GWh or KWh.
- The land area your city occupies in m2.
Background
As an introductory task, the students can investigate how much electricity major cities use through the interactive Electricity Use in Major Cities H5P below.
In order to answer the research question, we need to make some simplifying assumptions. Simplifying assumptions help to make complex problems more simplistic and, as such, more answerable. [1] When a model becomes so simplistic that it is no longer useful, you need to remove some of your simplifying assumptions to improve your model. It is important when you do research to discuss any simplifying assumptions you have made in solving your problem.
Here are some of the simplifying assumptions that we can use here:
- The total area of the city is available for solar panels.
In reality this is not true – many areas are unsuitable for solar energy production – think of the spaces between buildings etc. In addition, we would likely not want to have all of the sun blocked from our city. - All the solar panels are operating at peak efficiency.
Again, in a realistic scenario this would not be the case, some panels would be shaded by clouds, birds, aircrafts, etc. Also, over the course of a year, the panels might get dirty or damaged and that would decrease their output. - The entire area of the city is flat.
Our modelling tool only allows for flat surfaces. Most cities have some topography in them which can influence solar insolation, which means the position of the sun, especially in the winter. - It may also be useful to analyse only a small percentage of the area (say 10%) and then multiply to create an estimate for the whole area. This will speed calculations but may not be realistic as many areas of a city can differ wildly in topography.
These are some to get you started. Remember that any simplifying assumptions that you apply must be explained as shown above. You can also ask your students to make their own assumptions.
Procedure
1. Gather the data needed to answer the question above. Use links in the resources section or find your own data sets.
2. Download the free Energy3D software for your computer.
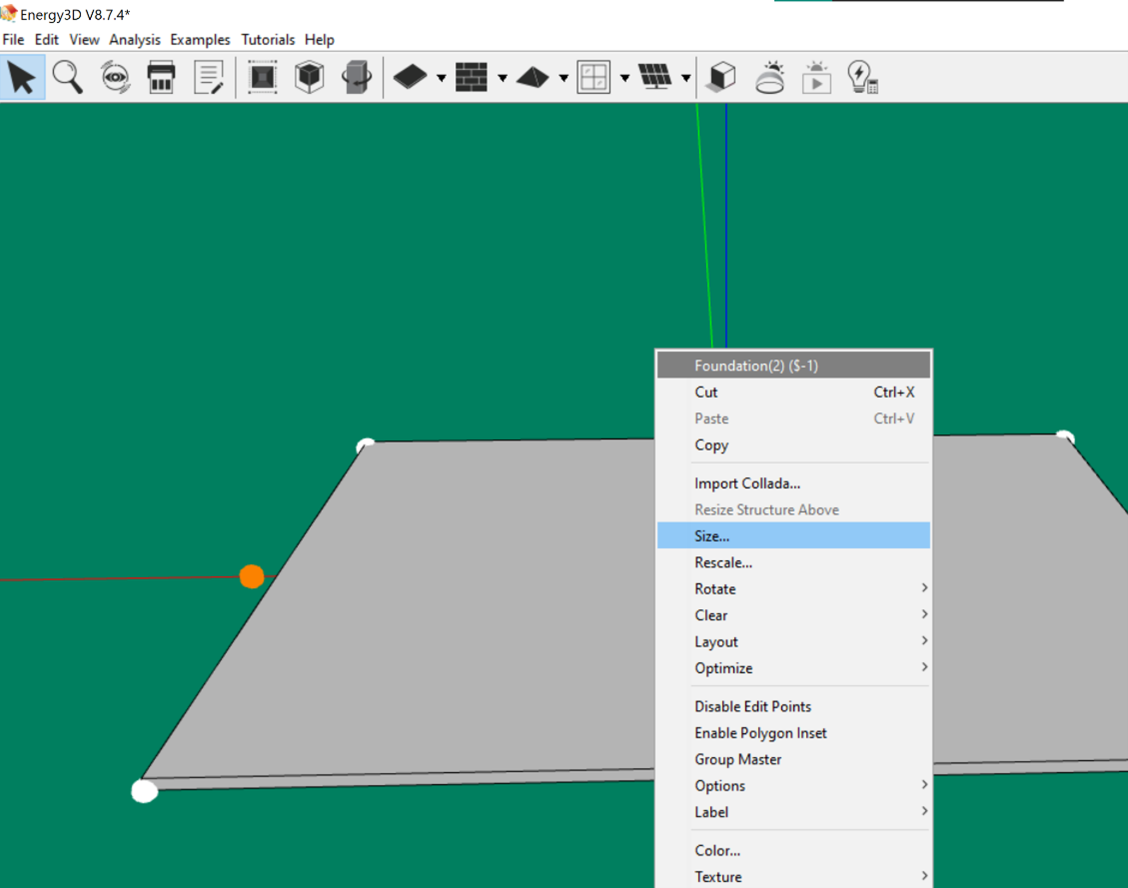
3. Open the software and create a platform sized for the area you will investigate (see simplifying assumptions section above). You can change the size of your platform by right-clicking on the platform and choosing size as shown below.
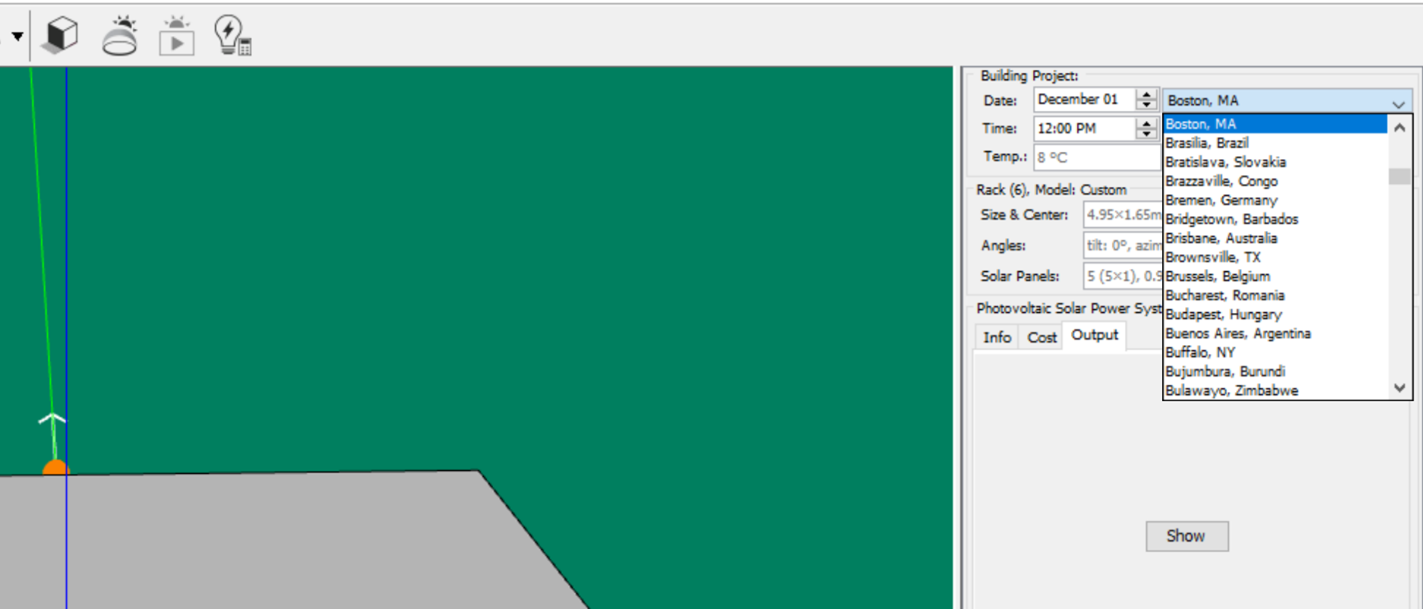
4. Choose the location for your platform by selecting the city closest to your area from the dropdown menu on the right as shown in in the figure below. It is better to choose a city than to use lat./lon. coordinates as cities include weather data in the simulation.
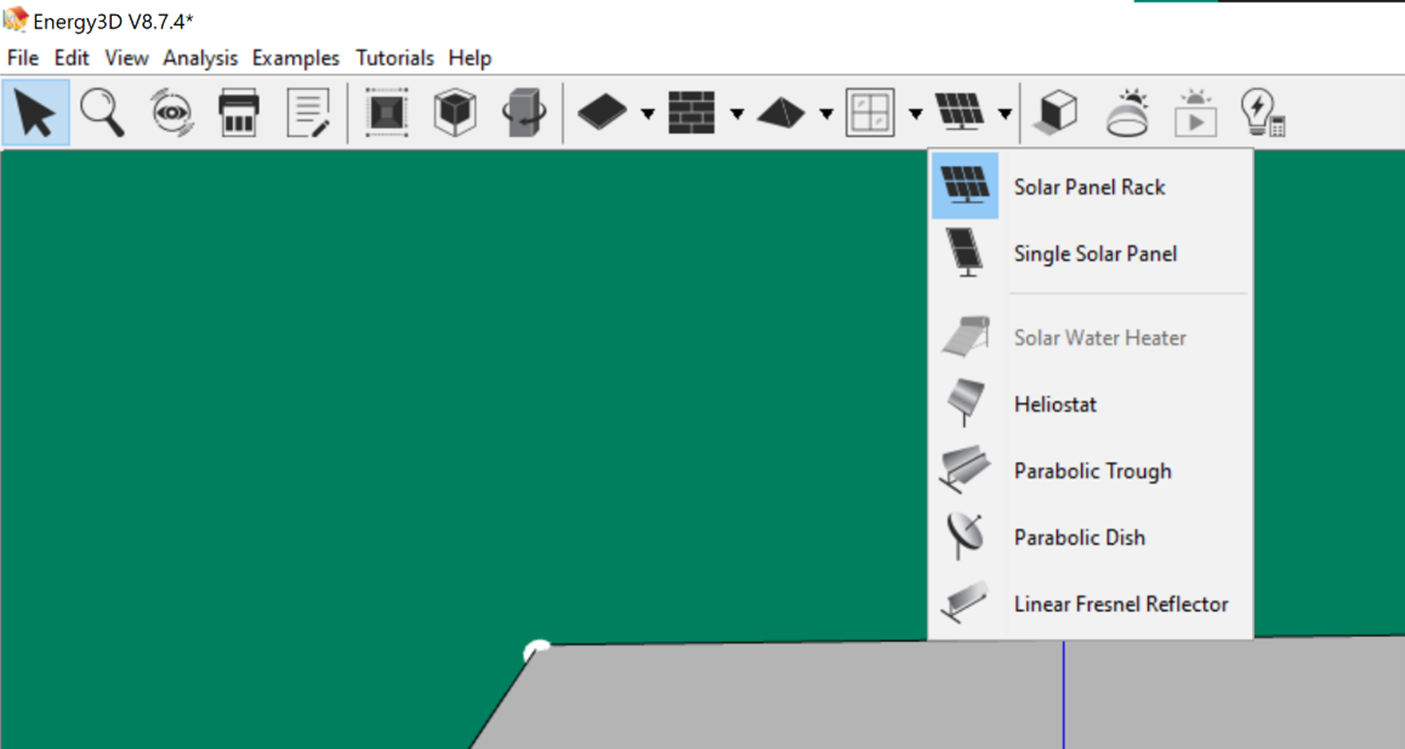
5. Begin adding solar panels to your area by choosing the solar panel icon from the menu at the top of the page and selecting solar panel rack as shown in the figure below. For now, do not change the attributes of the solar panel rack. In the ideas for advanced modelling section there is a discussion of some of the attributes that could be changed in order make a more realistic model, but for now let’s keep it simple. Once you have one rack installed, you can right-click on the rack and copy it to save time.
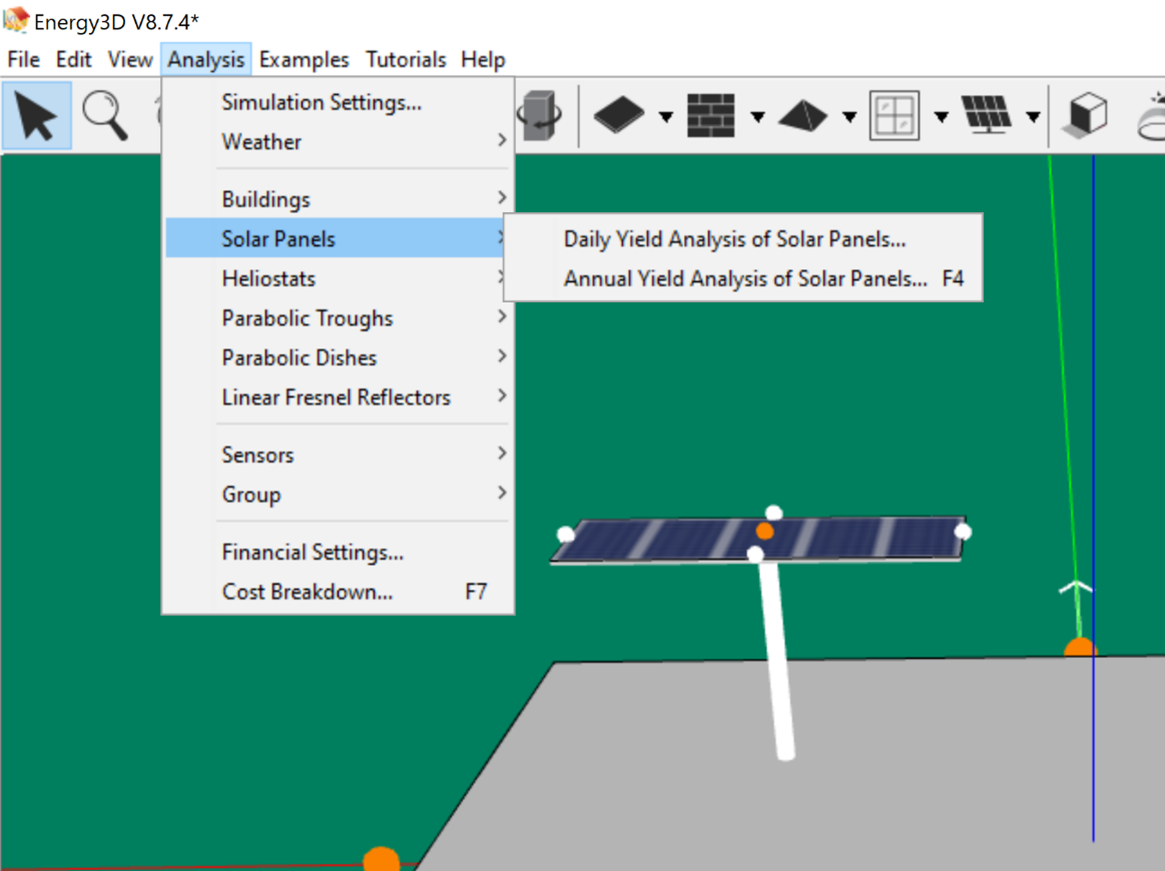
6. Once your platform is filled with solar panels begin your analysis by choosing the Analysis tab at the top and selecting Solar Panels – Annual Yield Analysis of Solar Panels as shown in the figure below.
7. Document your results using the worksheet template provided. You can download it as docx and as pdf file.
After the students have completed the modelling task, they can discuss questions on energy consumption in class or as a homework assignment. You can download the discussion question template as docx or as pdf file.
This tutorial shows you how to use the Energy3D software in detail.
There are many good websites available for providing reliable data. In Norway, Statistisk sentralbryå is an excellent place to start but there are others.
Here is an app showing real time energy data for many countries around the world – electricityMap | Live CO₂ emissions of electricity consumption
You can contact your town hall as well as doing some calculations based upon your own electricity consumption and scaling it up based upon the population of your town.
For data related to area, the web page of the town may have this information, or you can often find it on Wikipedia – just make sure to check the source.
It may be possible to estimate the roof area available for solar panels in your city. You can use a tool such as google maps and a transparent grid to estimate the area of your city that would truly be available for solar panels and as such your model would be a more realistic approach to answering the research question.
Another possibility would be to use the map on the website OpenLayers to measure a specific area.
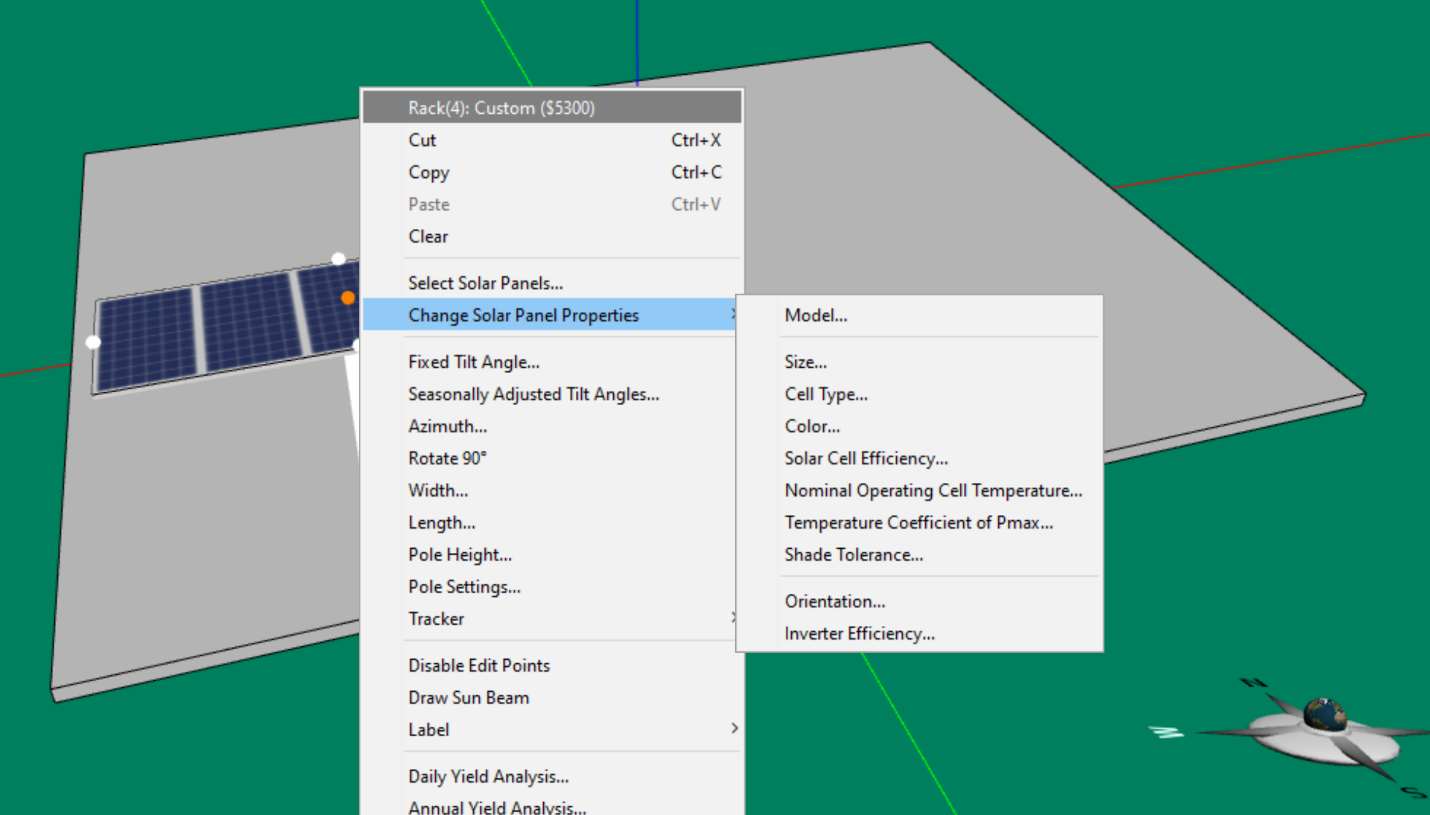
You can also adjust the properties of the solar panel racks by right-clicking on the rack to bring up the properties list shown in the figure below. Here there are a multitude of possible configurations that could possibly make your model more accurate. Remember that some settings, such as adding a tracking system will improve energy output but will incur an additional cost.
Taking the idea further
Co-operation activity
This activity can be assigned individually or assigned to small groups. It is possible to partner with both neighbouring communities and international partners to investigate and compare the energy analyses of different cities and towns. Given the maths required for the analysis, this project makes an interesting intradisciplinary teaching unit with maths classes.
Communication
There are many options for communicating the results of this activity, these include but are not limited to, a poster presentation, classroom presentation, or video. It may be possible to have an activity that is presented collaboratively with participating schools.
Taking action and involving your local community
Now that you have investigated the feasibility of using solar energy to power your city how can you act? Start locally – use the software to analyse your school building’s potential for solar energy. You can then contact your school’s administration to ask that your school becomes solarised. Write to your local government and ask what incentives are available to increase the amount of solar energy produced for your city. If there are none, you can contact the political parties present in your city/country and ask that they include solar incentives as part of their political platform.
Conclusion and outlook
Given the current global situation the project is more relevant than ever. It incorporates things that are a necessity now, such as viable options for online investigations, as well as addressing a topic vital to sustainable development – energy use and production. We have used this activity along with an ecological footprint calculator at the beginning of the teaching units on environmental science and sustainability to begin the conversation about how we can live sustainably on the planet. If you have access to actual solar cells, you could conduct a lab to compare your results to the simulation as well.
For teachers trying this project for the first time, our advice is to start with small areas of analysis. We found that even for students using new computers, the computing time for large areas was very long. This project is very scalable and could be used for instance to investigate the energy use and feasibility of students houses before scaling it up to look at the town. We also recommend finding a website like we have done for students to look for data ahead of time, especially with younger students.
Authors of Smart Cities: Gerald Decelles III (NO), Corina Toma (RO), Panagiota Argyri (GR)
Links to forward to your students
Facciotti, M. (2019, March 29). Models, Simplifying Assumptions, and Bounding. Biology LibreTexts.
Xie, C., Schimpf, J. C., Nourian, S., & Massicotte, J. (2018). Learning and teaching engineering design through modeling and simulation on a CAD platform. Computer Applications in Engineering Education, 26(4), 824–840.
Energy3D software https://energy.concord.org/energy3d/
Statistisk sentralbryå https://www.ssb.no/
electricityMap | Live CO₂ emissions of electricity consumption: https://app.electricitymap.org/map
OpenLayers https://openlayers.org/en/latest/examples/measure.html
Share this page